
When to Use This
If you are running one Rust dedicated server for a small community, tailing output_log.txt over SSH is workable — barely. The moment you add a second node, start caring about player behavior patterns, or need to correlate server errors with performance events, a local log file becomes a liability rather than an asset.
Centralizing with the Loki stack makes sense in these specific situations:
- You want to query player connect and disconnect events without grepping through gigabytes of raw text.
- You are running multiple game servers and need a single pane of glass in Grafana.
- You need alerting when error rates spike — for example, after a plugin update or map wipe.
- You want to retain logs beyond what the Rust process keeps in its rolling output file.
This setup is intentionally scoped to a single Linux host running both the Rust dedicated server and the observability stack. It is a practical starting point, not a Kubernetes-native deployment. If you are already running containerized workloads, the infrastructure automation posts on kuryzhev.cloud cover patterns that translate directly.
Setup
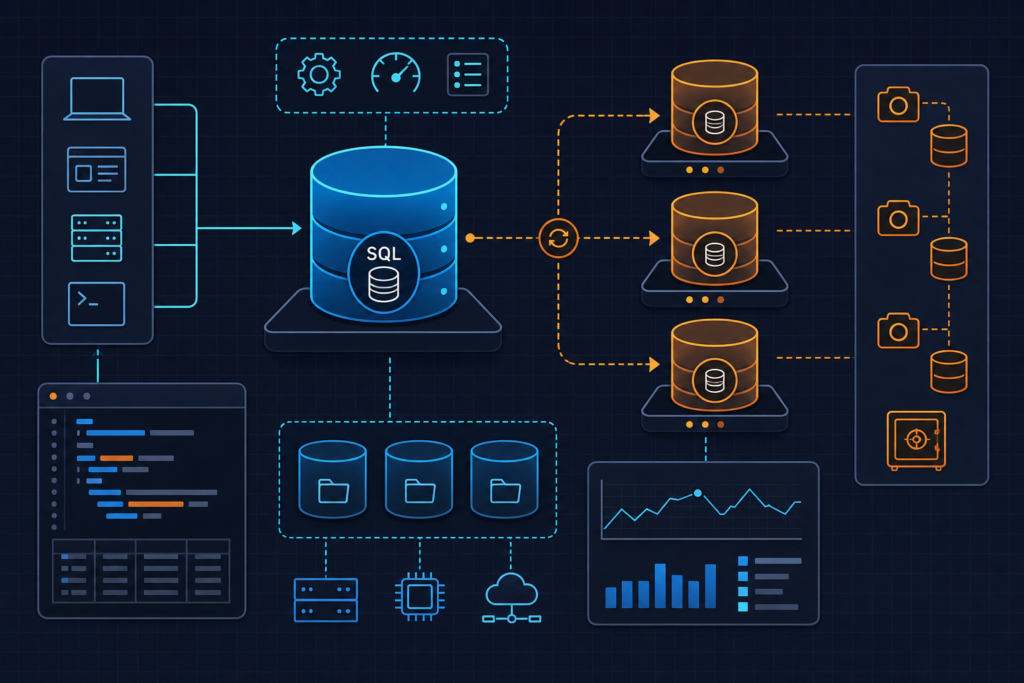
The stack has three components: Promtail reads the log file and ships entries to Loki, Loki stores and indexes them, and Grafana provides the query and dashboard interface. We will install all three as systemd-managed binaries on the same host as the Rust server.
Install Loki
Download the latest Loki binary from the Grafana Loki releases page and place it under /usr/local/bin.
curl -O -L "https://github.com/grafana/loki/releases/download/v3.0.0/loki-linux-amd64.zip"
unzip loki-linux-amd64.zip
chmod +x loki-linux-amd64
sudo mv loki-linux-amd64 /usr/local/bin/loki

sudo mkdir -p /etc/loki /var/lib/loki
Install Promtail
curl -O -L "https://github.com/grafana/loki/releases/download/v3.0.0/promtail-linux-amd64.zip"
unzip promtail-linux-amd64.zip
chmod +x promtail-linux-amd64
sudo mv promtail-linux-amd64 /usr/local/bin/promtail

sudo mkdir -p /etc/promtail /var/lib/promtail
Install Grafana
Grafana maintains an official APT repository. On Debian or Ubuntu:
sudo apt-get install -y apt-transport-https software-properties-common
wget -q -O - https://apt.grafana.com/gpg.key | sudo apt-key add -
echo "deb https://apt.grafana.com stable main" | sudo tee /etc/apt/sources.list.d/grafana.list
sudo apt-get update
sudo apt-get install grafana
Enable and start Grafana:
sudo systemctl enable grafana-server
sudo systemctl start grafana-server
Grafana listens on port 3000 by default. Loki will listen on 3100. Promtail exposes metrics on 9080. Verify none of these conflict with existing services before proceeding.
Configuration (with Code)
Loki Configuration
Create a minimal but production-aware Loki configuration at /etc/loki/loki-config.yaml. The ingester block values below control how aggressively Loki flushes log chunks to storage — tuning these prevents data loss if the process restarts unexpectedly.
# /etc/loki/loki-config.yaml

auth_enabled: false

server:
  http_listen_port: 3100
  grpc_listen_port: 9096

ingester:
  lifecycler:
    ring:
      kvstore:
        store: inmemory
      replication_factor: 1
  chunk_idle_period: 5m
  max_chunk_age: 1h
  chunk_retain_period: 30s

schema_config:
  configs:
    - from: 2024-01-01
      store: boltdb-shipper
      object_store: filesystem
      schema: v12
      index:
        prefix: index_
        period: 24h

storage_config:
  boltdb_shipper:
    active_index_directory: /var/lib/loki/index
    cache_location: /var/lib/loki/boltdb-cache
    shared_store: filesystem
  filesystem:
    directory: /var/lib/loki/chunks

limits_config:
  reject_old_samples: true
  reject_old_samples_max_age: 168h

compactor:
  working_directory: /var/lib/loki/compactor
  shared_store: filesystem
Create the systemd unit for Loki:
# /etc/systemd/system/loki.service
[Unit]
Description=Loki log aggregation service
After=network.target

[Service]
Type=simple
ExecStart=/usr/local/bin/loki -config.file=/etc/loki/loki-config.yaml
Restart=on-failure
User=loki

[Install]
WantedBy=multi-user.target
sudo useradd --system --no-create-home loki
sudo chown -R loki:loki /var/lib/loki /etc/loki
sudo systemctl daemon-reload
sudo systemctl enable loki
sudo systemctl start lokiConfirm it is running: systemctl status loki. You should see the service active and a line indicating it is listening on 3100.
Promtail Configuration
This is the core of the pipeline. The configuration below targets the Rust dedicated server log file at its default path, extracts a log level label from structured prefixes, drops noisy heartbeat lines, and adds static metadata that makes Grafana filtering straightforward.
# /etc/promtail/promtail-config.yaml
# Promtail configuration for Rust dedicated server log ingestion

server:
  http_listen_port: 9080
  grpc_listen_port: 0

positions:
  filename: /var/lib/promtail/positions.yaml

clients:
  - url: http://localhost:3100/loki/api/v1/push

scrape_configs:
  - job_name: rust-gameserver
    static_configs:
      - targets:
          - localhost
        labels:
          job: "rust-gameserver"
          host: "game-node-01"
          environment: "production"
          __path__: /home/steam/steamapps/common/rust_dedicated/RustDedicated_Data/output_log.txt

    pipeline_stages:
      # Extract log level from lines that contain [Warning], [Error], [Info]
      - regex:
          expression: '^\[(?P<level>Warning|Error|Info)\]'

      # Promote extracted level to a label (keep cardinality low)
      - labels:
          level:

      # Drop noisy heartbeat lines to reduce ingest volume
      - drop:
          expression: ".*Heartbeat.*"
          drop_counter_reason: "heartbeat_noise"

      # Parse timestamp from Rust log prefix format: MM/DD/YYYY HH:MM:SS
      - timestamp:
          source: time
          format: "01/02/2006 15:04:05"
          fallback_formats:
            - "2006-01-02T15:04:05Z07:00"

      # Add static metadata to every log entry
      - static_labels:
          game: "rust"
          server_region: "eu-west"

      # Output the cleaned log line
      - output:
          source: message
Create a systemd unit for Promtail, then enable it:
# /etc/systemd/system/promtail.service
[Unit]
Description=Promtail log shipping agent
After=network.target

[Service]
Type=simple
ExecStart=/usr/local/bin/promtail -config.file=/etc/promtail/promtail-config.yaml
Restart=on-failure
User=promtail

[Install]
WantedBy=multi-user.target
sudo useradd --system --no-create-home promtail
# Promtail needs read access to the Rust log file
sudo usermod -aG steam promtail
sudo chown -R promtail:promtail /var/lib/promtail /etc/promtail
sudo systemctl daemon-reload
sudo systemctl enable promtail
sudo systemctl start promtailGrafana Datasource
You can provision the Loki datasource declaratively rather than clicking through the UI. Create the following file and restart Grafana:
# /etc/grafana/provisioning/datasources/loki.yaml
apiVersion: 1

datasources:
  - name: Loki
    type: loki
    access: proxy
    url: http://localhost:3100
    isDefault: true
    version: 1
    editable: false
sudo systemctl restart grafana-serverNavigate to http://<your-host>:3000, log in with the default credentials (admin / admin), and open Explore. Select the Loki datasource and confirm you can see the rust-gameserver job label.
Examples
The following LogQL queries are written against the label set defined in the Promtail configuration above. Refer to the Loki LogQL documentation for the full query language reference.
Filter Player Connection Events
Rust logs player joins in the format PlayerName joined [steamid]. This query isolates those lines:
{job="rust-gameserver"} |= "joined ["Filter by Log Level
Because we promoted level to a label in the pipeline, you can filter at the stream selector level rather than scanning every line — which is significantly more efficient at scale:
{job="rust-gameserver", level="Error"}Kill Feed Events
Rust logs PvP kills with the pattern was killed by. Combine with a rate to build a kills-per-minute panel:
rate({job="rust-gameserver"} |= "was killed by" [5m])Error Rate Over Time
This metric query is suitable for a Grafana time series panel tracking server stability after plugin deployments:
sum(rate({job="rust-gameserver", level="Error"}[5m]))Player Disconnect Events
{job="rust-gameserver"} |= "disconnecting"Pair this with the connection query in a stat panel to show concurrent session deltas over your wipe cycle.
Common Mistakes
High-Cardinality Labels
The most damaging mistake is adding dynamic values — Steam IDs, player names, or IP addresses — as Loki labels inside a pipeline_stages labels block. Loki’s index is designed for low-cardinality label sets. A server with 200 unique players will create 200 distinct streams if you label by player name, which causes index bloat, slow queries, and eventually ingester memory pressure. Extract those fields as structured metadata or query them with |= "pattern" instead.
Deleting positions.yaml
The file at /var/lib/promtail/positions.yaml tracks how far Promtail has read into each log file. If you delete it — perhaps while troubleshooting — Promtail will re-ingest the entire log file from the beginning on next start. On an active server with weeks of logs, this will flood Loki with duplicate entries and may trigger rate limiting. If you need to reset ingestion for a specific file, edit the positions file and remove only the relevant entry.
Wrong Log File Path
The __path__ label in Promtail must point to the exact file Rust is writing to. If you installed the server under a different Steam user or changed the install directory, the default path /home/steam/steamapps/common/rust_dedicated/RustDedicated_Data/output_log.txt will not exist and Promtail will silently produce no logs. Verify with ls -lh before starting the service.
Grafana Datasource URL Mismatch
The datasource URL must be http://localhost:3100 when Grafana and Loki are on the same host. Using 127.0.0.1 usually works, but using a public IP or hostname can introduce DNS resolution delays or firewall blocks. If the Explore panel shows “Bad Gateway” or “connection refused,” this is the first thing to check.
Timestamp Parsing Failures
If the timestamp pipeline stage cannot parse the log line’s timestamp, Promtail falls back to the current ingestion time. This means your Grafana panels will show accurate wall-clock timing but historical log lines loaded after a restart will all appear at the same timestamp. Validate your format string against actual log output using promtail --dry-run before deploying to production.
Loki Not Flushing Chunks
If recent log lines are missing from Grafana queries, the ingester may be holding them in an open chunk. The chunk_idle_period: 5m and max_chunk_age: 1h values in the Loki config control this behavior. For a game server where you want near-real-time visibility, keep chunk_idle_period at five minutes or below. Setting it too high means logs are queryable only after the chunk closes.