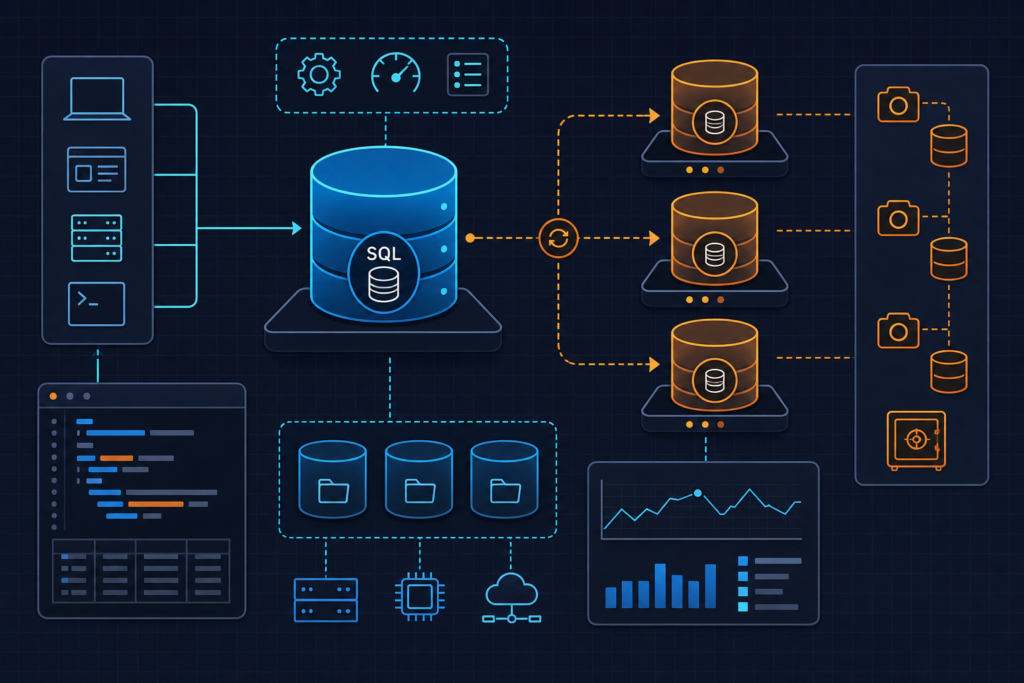
Fix Predictive Alerting False Positives in Prometheus Python Models
Predictive alerting on Prometheus data pages on-call for pod restarts, not real anomalies? Here's the root cause and three fixes that work.
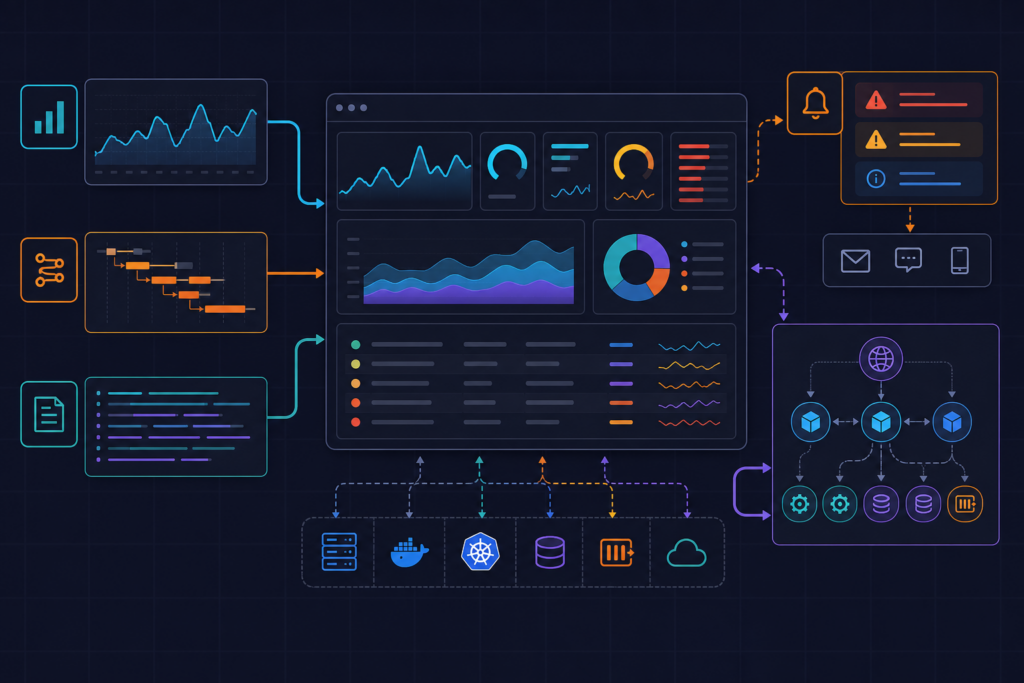
Building an Online Anomaly Scoring Sidecar for Grafana Alerts
AI anomaly detection in Grafana is mostly statistics, not magic — here's how to wire online scoring into alerts without flapping.
Grafana Alerting Checklist: Wiring AI Anomaly Scores Correctly
A practical Grafana AI anomaly detection checklist for wiring model scores into unified alerting without alert storms or false negatives.
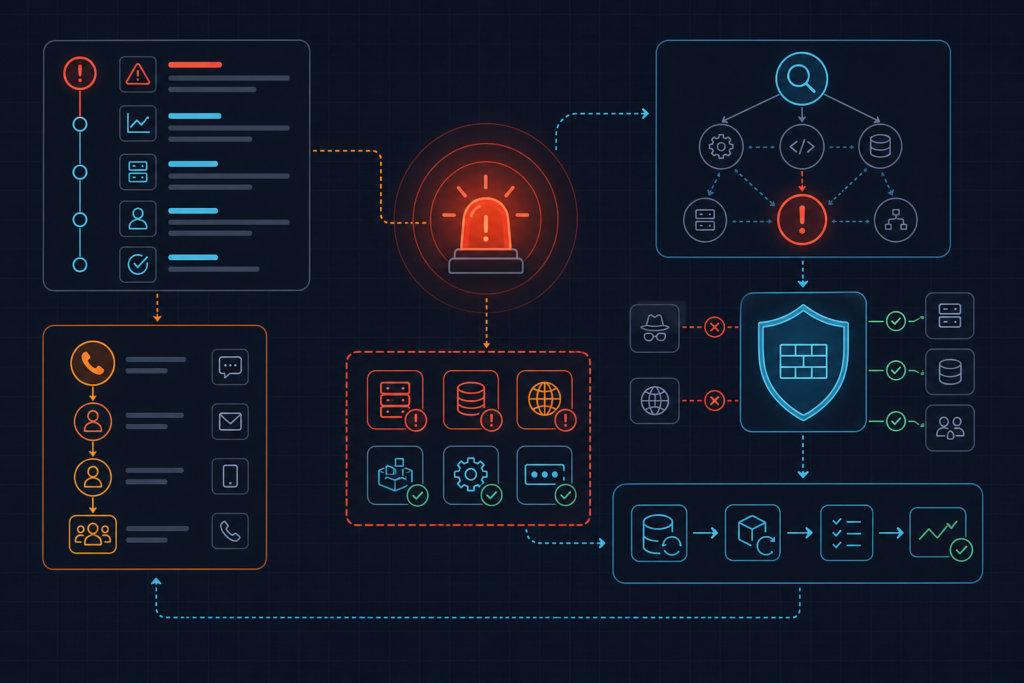
LLM Log Triage With Loki and CloudWatch Insights
Cut incident triage from 8 minutes to 30 seconds by piping Loki and CloudWatch logs directly into an LLM. Real patterns, real code, real cost controls.
Loki Retention and Index Tuning for High-Volume Log Pipelines
When log ingestion rates climb into the tens of gigabytes per day, default Loki settings quickly become a liability — bloated indexes, runaway storage costs, and silent retention failures are the most common consequences. This guide walks through a production-grade configuration covering retention policies, TSDB index tuning, and compactor validation for Loki deployments under sustained load.
Reducing Alert Fatigue with Prometheus Alertmanager Routing
Alert fatigue silently degrades incident response — engineers start ignoring notifications, and real incidents get buried in noise. This post walks through Alertmanager routing configuration with inhibition rules, grouping strategies, and tiered receivers to restore signal quality in production monitoring.
Centralizing Rust Dedicated Server Logs with Loki, Promtail, and Grafana
Running a Rust dedicated server without centralized logging means chasing a single flat file every time something goes wrong. This tutorial walks through wiring Promtail, Loki, and Grafana into a production-grade log pipeline on the same Linux host as your game server.
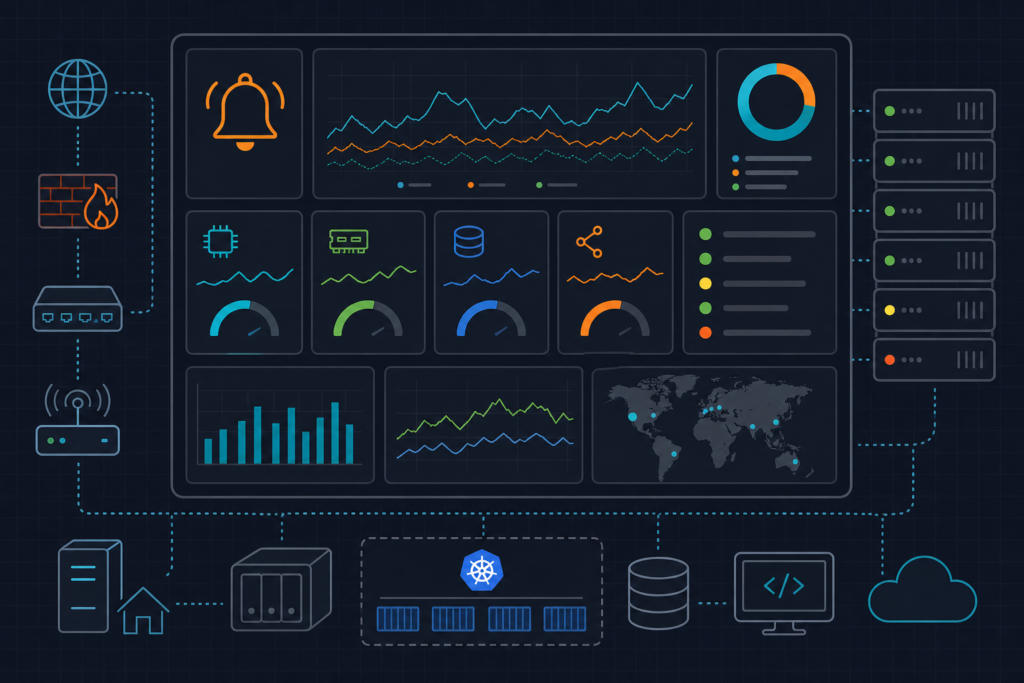
Grafana Alerting Rules for Docker Host and Container Metrics
A practical walkthrough for wiring Prometheus alerting rules, Alertmanager notification channels, and Grafana-native alert rules into a single monitoring pipeline for Docker host and container metrics. Covers PromQL expressions for CPU throttling, memory pressure, and container restarts — with validation steps at each stage.
☕ Support us · 💳 Monobank