The Problem

AWS Cost Anomaly Detection with tag-based routing and Lambda enrichment solves a specific operational gap that most teams hit within months of scaling their AWS footprint: the default billing alert fires, engineers scramble to open Cost Explorer, and nobody can immediately answer which workload, which team, or which environment caused the spike. By the time someone traces it to a misconfigured Auto Scaling group in staging or an unexpectedly large data transfer from a third-party integration, hours have passed and the damage is done.
The native alerting surface is intentionally broad. A standard budget alert tells you that account-level spend crossed a threshold — nothing more. Even when you configure Cost Anomaly Detection through the console, the default SNS message contains an anomaly ID and a dollar figure. It does not tell you which team owns the offending resource, which environment it belongs to, or what the root cause service is. Teams end up routing these alerts to a shared channel where they sit unacknowledged because nobody feels clear ownership.
There is also a subtler problem with threshold configuration. Setting the anomaly subscription threshold to zero feels thorough, but it generates alert storms during normal daily cost variance — weekday versus weekend patterns, month-end batch jobs, reserved instance amortization shifts. The noise trains teams to ignore the channel, which defeats the purpose entirely.
The pattern described here addresses both problems: enriched context so alerts are immediately actionable, and sensible thresholds so alerts are trusted.
Approach
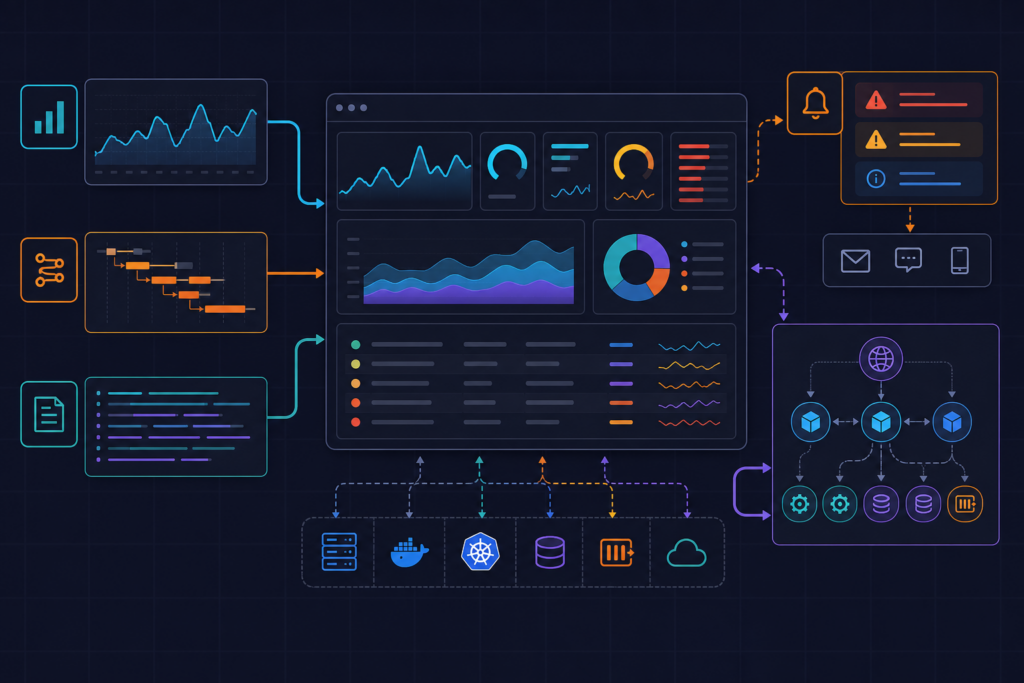
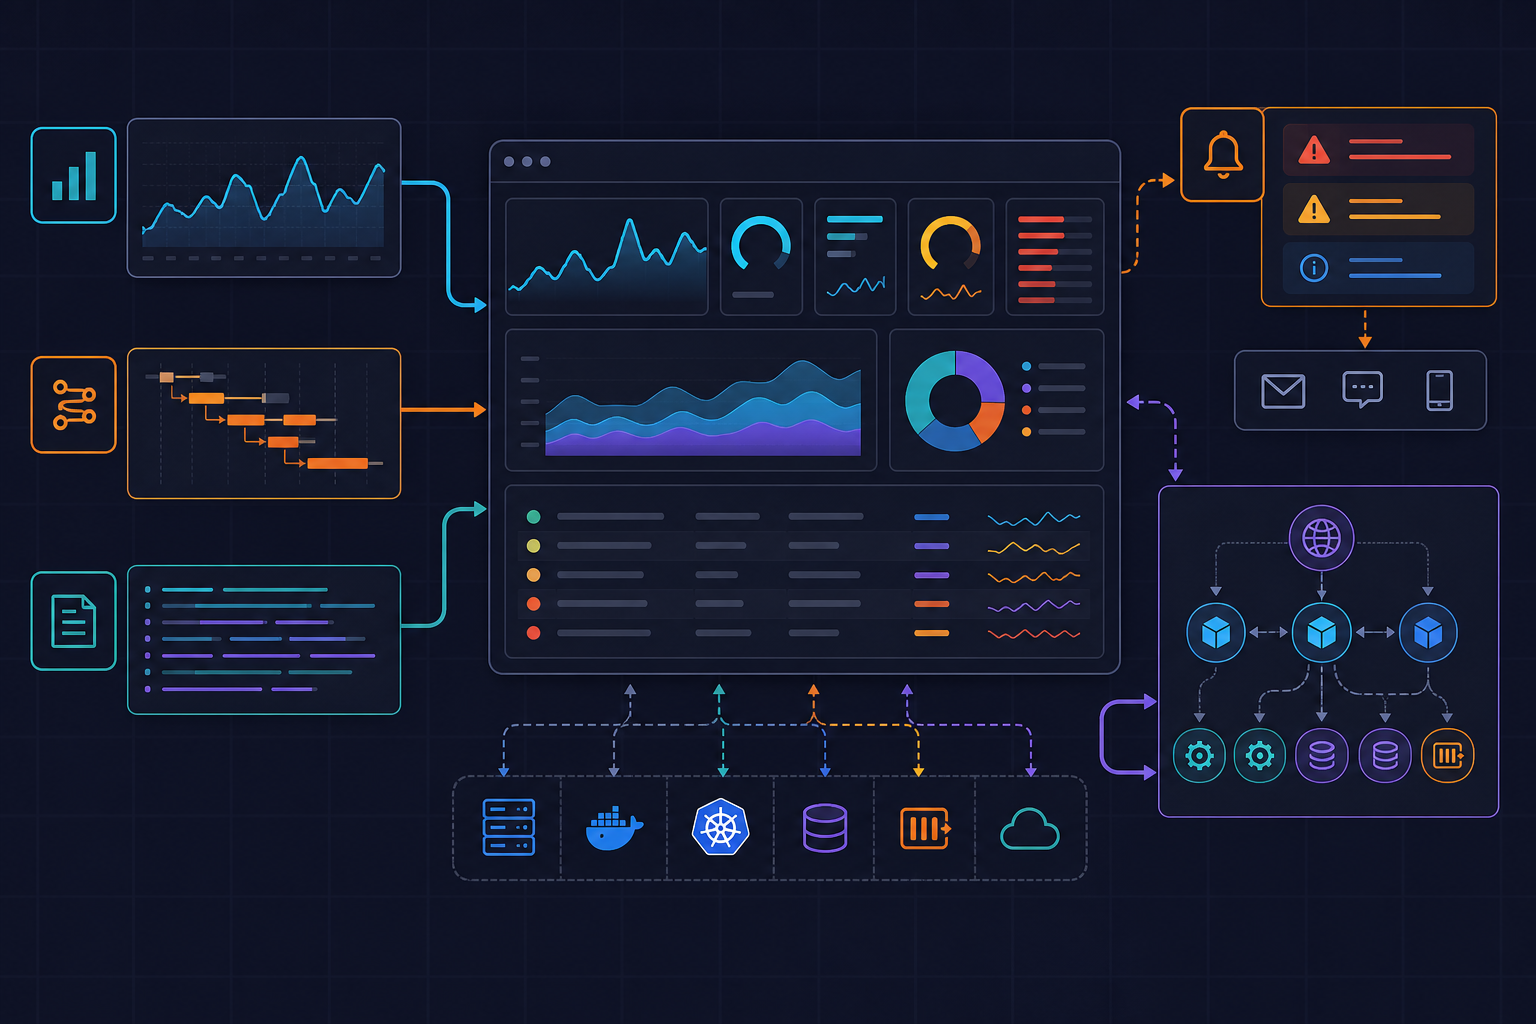
The architecture has four layers that work in sequence. First, anomaly monitors are scoped using cost allocation tags rather than watching the entire account. This means a spike in the payments team’s production environment generates a separate anomaly from a spike in the data-platform team’s staging environment — they never collapse into a single undifferentiated alert.
Second, an SNS subscription carries the anomaly notification downstream. The SNS topic requires a resource policy that explicitly permits ce.amazonaws.com to publish — a step that is easy to miss and causes silent failures.
Third, a Lambda function triggered by SNS calls ce.get_anomalies with the anomaly ID to retrieve the full detail record, including the RootCauses array that contains the linked account, region, service, and usage type. It then calls the Resource Groups Tagging API to pull the Team and Environment tags from the offending resources and assembles a structured payload.
Fourth, the enriched payload routes to the correct Slack channel or PagerDuty escalation policy based on the tag values. The routing key is resolved at runtime from the tag data, not hardcoded into the function.
Cost allocation tags must be activated in the Billing console before they can appear in anomaly monitor expressions. Activation can take up to 24 hours to propagate, so this is a prerequisite to complete before any infrastructure is deployed. You can find the activation surface under Billing → Cost allocation tags in the AWS console.
For a related look at how tagging discipline connects to broader infrastructure governance patterns, see the posts on kuryzhev.cloud covering IAM and resource lifecycle automation.
Setting Up Cost Anomaly Detection with Tag-Based Monitors
Tag-based monitors use MonitorType: CUSTOM_EXPRESSION rather than the simpler DIMENSIONAL type. The expression filters costs to a specific tag value, so anomaly detection runs against the spend profile of that tag scope rather than the account as a whole. This produces much tighter baselines and fewer false positives.
The following Terraform configuration creates a monitor scoped to the payments team tag and wires it to an anomaly subscription. Note that the Terraform AWS provider must be at version 4.9.0 or later for aws_ce_anomaly_monitor and aws_ce_anomaly_subscription to be available.
resource "aws_ce_anomaly_monitor" "team_payments" {
  name         = "team-payments-anomaly-monitor"
  monitor_type = "CUSTOM_EXPRESSION"

  monitor_specification = jsonencode({
    Tags = {
      Key    = "Team"
      Values = ["payments"]
    }
  })
}

resource "aws_sns_topic" "cost_anomaly_alerts" {
  name = "cost-anomaly-alerts"
}

resource "aws_sns_topic_policy" "allow_ce" {
  arn = aws_sns_topic.cost_anomaly_alerts.arn

  policy = jsonencode({
    Version = "2012-10-17"
    Statement = [
      {
        Sid       = "AllowCostExplorerPublish"
        Effect    = "Allow"
        Principal = { Service = "ce.amazonaws.com" }
        Action    = "sns:Publish"
        Resource  = aws_sns_topic.cost_anomaly_alerts.arn
      }
    ]
  })
}

resource "aws_ce_anomaly_subscription" "team_payments" {
  name      = "team-payments-subscription"
  frequency = "DAILY"

  monitor_arn_list = [
    aws_ce_anomaly_monitor.team_payments.arn
  ]

  subscriber {
    type    = "SNS"
    address = aws_sns_topic.cost_anomaly_alerts.arn
  }

  threshold_expression {
    and {
      dimension {
        key           = "ANOMALY_TOTAL_IMPACT_PERCENTAGE"
        values        = ["20"]
        match_options = ["GREATER_THAN_OR_EQUAL"]
      }
    }
    and {
      dimension {
        key           = "ANOMALY_TOTAL_IMPACT_ABSOLUTE"
        values        = ["50"]
        match_options = ["GREATER_THAN_OR_EQUAL"]
      }
    }
  }
}
The threshold expression combines a 20% deviation from expected spend with a $50 absolute floor. Both conditions must be true for the subscription to fire. This combination prevents alert storms from small-dollar fluctuations that happen to exceed the percentage threshold on low-spend services, while also filtering out large-percentage swings on near-zero baselines.
Repeat this pattern for each team tag. If you have many teams, a Terraform for_each over a map of team names keeps the configuration DRY.
Routing Alerts Through SNS and Lambda for Enrichment
The SNS topic triggers a Lambda function whose sole job is to take the thin anomaly notification and return a rich, human-readable payload. The function calls two AWS APIs: ce.get_anomalies to retrieve root cause data, and resourcegroupstaggingapi.get_resources to fetch the ownership tags attached to the affected resources.
Sensitive configuration — the Slack webhook URL or PagerDuty routing key — is stored in SSM Parameter Store and fetched once at cold start. Hardcoding these values in environment variables exposes them in the Lambda console and in any Terraform state that captures the function configuration. The SSM parameter name is passed as an environment variable; the value itself never leaves Parameter Store in plaintext.
Below is the complete handler. The RootCauses array in the ce.get_anomalies response contains LinkedAccount, Region, Service, and UsageType — all included in the formatted Slack message so the on-call engineer has enough context to open the right Cost Explorer view immediately.
# src/enrich_anomaly/handler.py
import os, json, boto3, urllib.request

ce = boto3.client("ce")
tagging = boto3.client("resourcegroupstaggingapi")
ssm = boto3.client("ssm")

def get_param(name):
    return ssm.get_parameter(Name=name, WithDecryption=True)["Parameter"]["Value"]

SLACK_URL = get_param(os.environ["SLACK_WEBHOOK_PARAM"])

def lambda_handler(event, context):
    for record in event["Records"]:
        message = json.loads(record["Sns"]["Message"])
        anomaly_id = message.get("anomalyId") or message.get("AnomalyId")

        anomaly = ce.get_anomalies(
            AnomalyIds=[anomaly_id]
        )["Anomalies"][0]

        impact = anomaly["Impact"]
        root_causes = anomaly.get("RootCauses", [])
        date_range = anomaly["AnomalyDateInterval"]

        # Pull tag context for the first root cause service
        tag_context = {}
        if root_causes:
            rc = root_causes[0]
            resources = tagging.get_resources(
                TagFilters=[
                    {"Key": "Environment", "Values": []},
                    {"Key": "Team", "Values": []},
                ],
                ResourceTypeFilters=[rc.get("Service", "").lower().replace(" ", "")],
            ).get("ResourceTagMappingList", [])
            if resources:
                tag_context = {
                    t["Key"]: t["Value"]
                    for t in resources[0].get("Tags", [])
                }

        team = tag_context.get("Team", "unknown-team")
        environment = tag_context.get("Environment", "unknown-env")
        total_impact = impact.get("TotalImpact", 0)
        expected = impact.get("TotalExpectedSpend", 0)

        slack_payload = {
            "text": (
                f":rotating_light: *Cost Anomaly Detected*\n"
                f"*Team:* {team}  |  *Env:* {environment}\n"
                f"*Anomaly ID:* `{anomaly_id}`\n"
                f"*Period:* {date_range.get('StartDate')} \u2192 {date_range.get('EndDate', 'ongoing')}\n"
                f"*Total Impact:* ${total_impact:,.2f}  (expected ~${expected:,.2f})\n"
                f"*Root Cause:* {json.dumps(root_causes[0] if root_causes else {}, indent=2)}"
            )
        }

        req = urllib.request.Request(
            SLACK_URL,
            data=json.dumps(slack_payload).encode(),
            headers={"Content-Type": "application/json"},
            method="POST",
        )
        with urllib.request.urlopen(req) as resp:
            print(f"Slack response: {resp.status} for anomaly {anomaly_id}")

    return {"statusCode": 200}
The Lambda execution role needs ce:GetAnomalies, tag:GetResources, and ssm:GetParameter on the specific parameter ARN. Avoid attaching broad read policies — the function needs exactly three permissions and nothing else.
Delivering Actionable Notifications to Slack or PagerDuty
With the tag context resolved inside the Lambda, routing to the correct destination becomes a straightforward lookup. If your organization maps team names to Slack channel webhook URLs in a configuration file or DynamoDB table, the Lambda can retrieve the correct endpoint at runtime rather than sending everything to a single shared channel.
A simple approach is to store per-team webhook URLs as SSM parameters under a consistent naming convention, such as /cost-alerts/slack-webhook/payments, and construct the parameter name from the resolved team tag value.
# Dynamic routing by team tag
def get_team_webhook(team: str) -> str:
    param_name = f"/cost-alerts/slack-webhook/{team}"
    try:
        return ssm.get_parameter(
            Name=param_name, WithDecryption=True
        )["Parameter"]["Value"]
    except ssm.exceptions.ParameterNotFound:
        # Fall back to a general ops channel if the team has no dedicated webhook
        return get_param(os.environ["FALLBACK_WEBHOOK_PARAM"])
For PagerDuty, the same pattern applies: store routing keys per team under a parallel SSM path and use the Events API v2 endpoint. The severity field can be derived from the impact magnitude — anomalies above a configurable dollar threshold escalate as critical, smaller ones as warning.
# PagerDuty Events API v2 payload
def send_pagerduty(routing_key: str, anomaly_id: str, team: str, impact: float) -> None:
    severity = "critical" if impact >= 500 else "warning"
    payload = {
        "routing_key": routing_key,
        "event_action": "trigger",
        "dedup_key": anomaly_id,
        "payload": {
            "summary": f"Cost anomaly for team {team}: ${impact:,.2f} above expected",
            "severity": severity,
            "source": "aws-cost-anomaly-detection",
            "custom_details": {"anomaly_id": anomaly_id, "team": team},
        },
    }
    req = urllib.request.Request(
        "https://events.pagerduty.com/v2/enqueue",
        data=json.dumps(payload).encode(),
        headers={"Content-Type": "application/json"},
        method="POST",
    )
    with urllib.request.urlopen(req) as resp:
        print(f"PagerDuty response: {resp.status}")
The dedup_key set to the anomaly ID prevents duplicate pages if the Lambda is invoked more than once for the same event — which can happen when SNS retries delivery after a transient Lambda error.
Verify It Works
Testing this pipeline end-to-end requires a synthetic cost spike on a known tagged resource. The most reliable method is to launch an EC2 instance type with a high on-demand rate — a GPU instance or a large memory-optimized type — tagged with the exact Team and Environment values your monitor watches, run it for a short period, and then terminate it. Cost Anomaly Detection typically identifies the spike within a few hours, though the detection latency depends on how frequently Cost Explorer ingests usage data for your account.
While waiting for the organic detection path, you can test the Lambda enrichment logic directly by constructing a synthetic SNS event with a known anomaly ID from a past event.
# Synthetic test event for Lambda console or CLI invocation
{
  "Records": [
    {
      "Sns": {
        "Message": "{\"anomalyId\": \"YOUR_KNOWN_ANOMALY_ID\"}"
      }
    }
  ]
}
Invoke the function with this payload and verify three things: the CloudWatch log shows the correct team and environment values extracted from the tagging API response, the Slack message arrives in the expected channel rather than the fallback, and the root cause block in the message contains a non-empty service and usage type.
Common failure modes to check during verification:
- Empty tag context: The cost allocation tag was not activated in the Billing console before the monitor was created, or activation has not yet propagated. Confirm the tag appears under Billing → Cost allocation tags → Active.
- SNS delivery failure: The topic resource policy is missing the
ce.amazonaws.comprincipal. Check the SNS topic’s access policy directly in the console. - Lambda timeout: The tagging API call with broad
ResourceTypeFilterscan be slow on accounts with many resources. Set the Lambda timeout to at least 30 seconds and consider narrowing the resource type filter using the service name from the root cause. - Alert storm on first deploy: If the subscription threshold was initially set to zero during testing and not updated, historical anomalies may replay. Set the threshold before connecting the SNS trigger to the Lambda.
Related Ideas
Once the core pipeline is stable, several extensions are worth considering depending on how your organization manages cost accountability.
Anomaly feedback loops. Cost Anomaly Detection supports a feedback mechanism where you can mark an anomaly as expected via ce.provide-anomaly-feedback. Wrapping this in a Slack interactive button — so the on-call engineer can acknowledge a known spike directly from the alert — trains the service’s baseline model over time and reduces repeat notifications for recurring patterns like month-end batch jobs.
Per-tag budget hard limits. Anomaly detection is probabilistic and looks at deviation from a learned baseline. It complements but does not replace hard budget limits. AWS Budgets supports tag-scoped budgets with SNS actions that can trigger the same Lambda enrichment pipeline, giving you both a statistical anomaly signal and a deterministic ceiling for each team.
Cross-account aggregation via AWS Organizations. If you manage multiple AWS accounts, anomaly monitors can be created at the management account level with MonitorType: DIMENSIONAL scoped to LINKED_ACCOUNT. Combining this with the tag-based monitors described here gives you both account-level visibility and team-level attribution in a single alert pipeline.
Scheduled cost digest. The same Lambda pattern can run on a daily EventBridge schedule to produce a cost summary per team tag, not just on anomaly events. This shifts the conversation from reactive firefighting to proactive ownership — teams see their spend trend each morning rather than receiving only spike notifications.