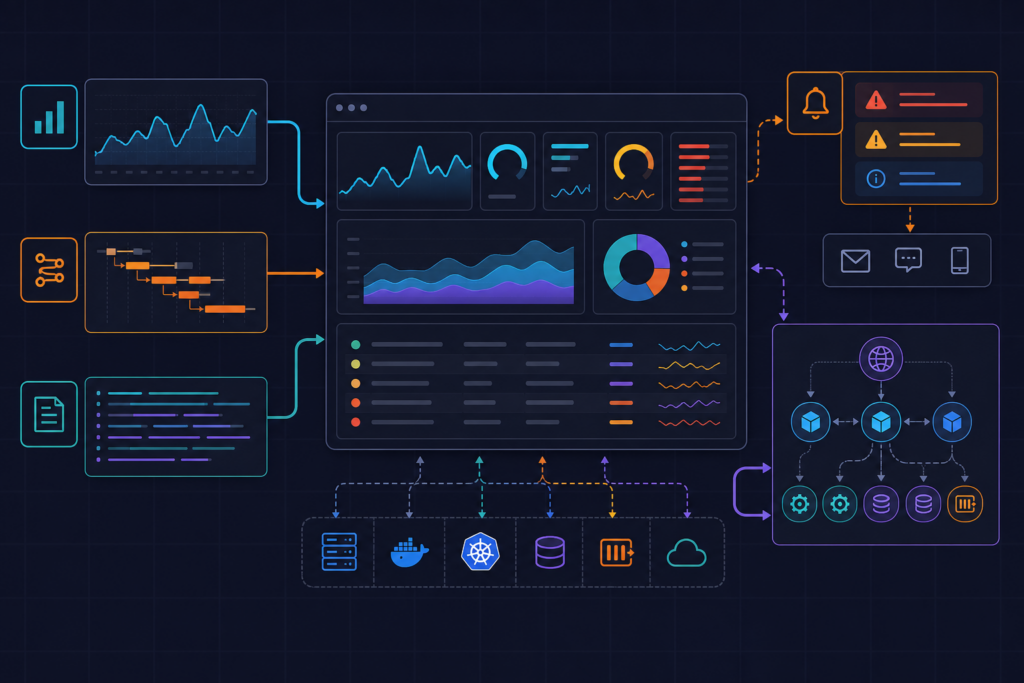
AWS Cost Anomaly Detection with Tag-Based Routing and Lambda Enrichment
Default AWS billing alerts tell you that spending is up — they rarely tell you why, or who owns the problem. This post walks through a production-ready pattern that combines Cost Anomaly Detection, SNS routing, and a Lambda enrichment layer to deliver alerts that include the responsible team, environment, and root cause service.
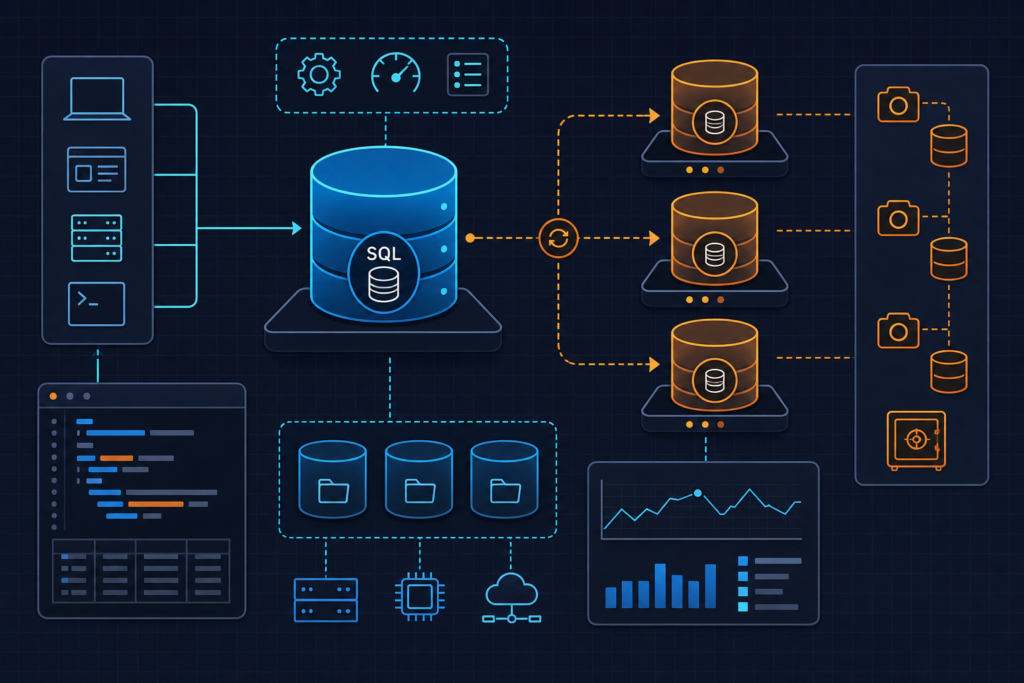
PostgreSQL VACUUM Monitoring and Bloat Prevention in Production
Table bloat is one of the quieter killers of PostgreSQL performance — it accumulates gradually, inflates I/O, and often goes unnoticed until query times spike. This post walks through a production-grade approach to measuring bloat, tuning autovacuum per table, and wiring Prometheus alerts before the damage compounds.
Loki Retention and Index Tuning for High-Volume Log Pipelines
When log ingestion rates climb into the tens of gigabytes per day, default Loki settings quickly become a liability — bloated indexes, runaway storage costs, and silent retention failures are the most common consequences. This guide walks through a production-grade configuration covering retention policies, TSDB index tuning, and compactor validation for Loki deployments under sustained load.
Reducing Alert Fatigue with Prometheus Alertmanager Routing
Alert fatigue silently degrades incident response — engineers start ignoring notifications, and real incidents get buried in noise. This post walks through Alertmanager routing configuration with inhibition rules, grouping strategies, and tiered receivers to restore signal quality in production monitoring.
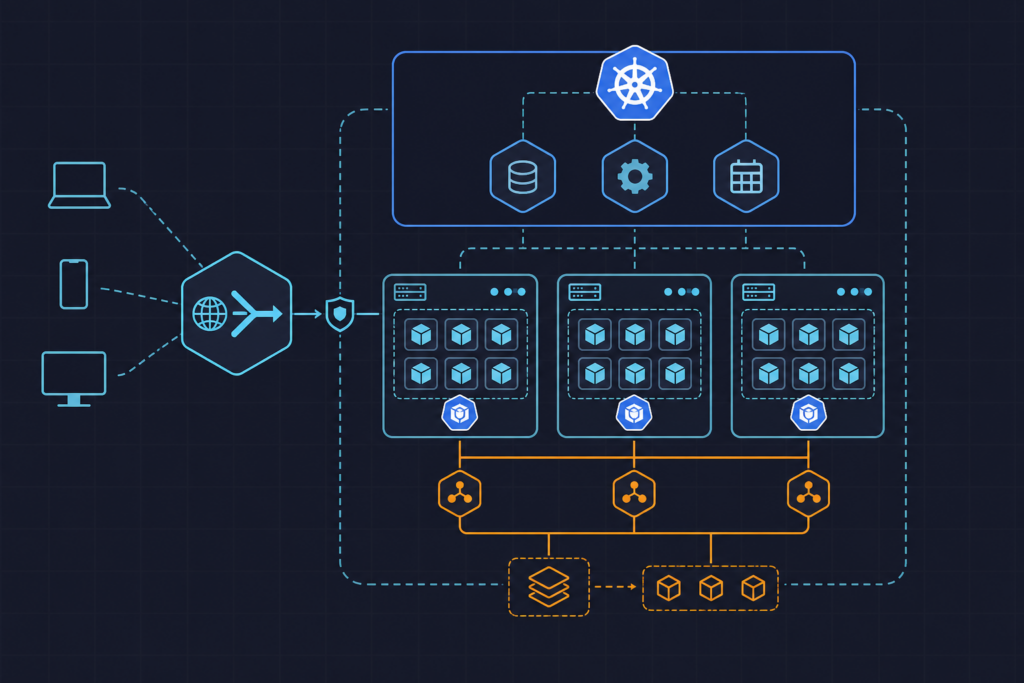
Kubernetes HPA and VPA Rightsizing for Production Autoscaling
Horizontal and vertical autoscaling in Kubernetes serve different purposes, and running them together without a clear ownership model leads to resource contention and unpredictable pod behavior. This walkthrough establishes a production-grade HPA and VPA configuration where each controller owns a distinct resource dimension.
Centralizing Rust Dedicated Server Logs with Loki, Promtail, and Grafana
Running a Rust dedicated server without centralized logging means chasing a single flat file every time something goes wrong. This tutorial walks through wiring Promtail, Loki, and Grafana into a production-grade log pipeline on the same Linux host as your game server.
Grafana Alerting Rules for Docker Host and Container Metrics
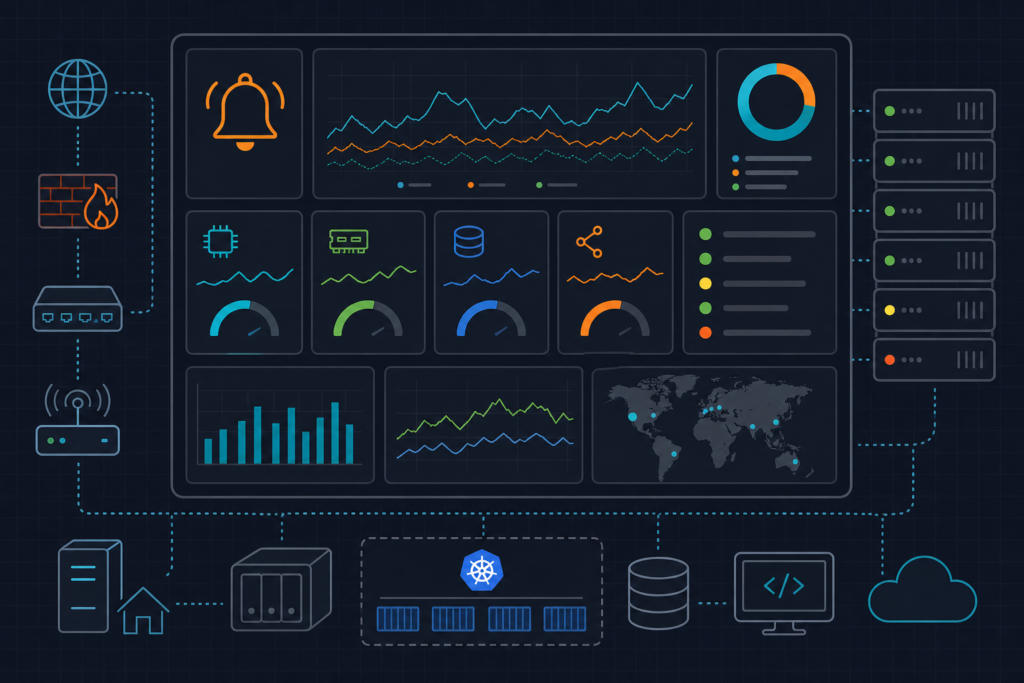
A practical walkthrough for wiring Prometheus alerting rules, Alertmanager notification channels, and Grafana-native alert rules into a single monitoring pipeline for Docker host and container metrics. Covers PromQL expressions for CPU throttling, memory pressure, and container restarts — with validation steps at each stage.
☕ Support us · 💳 Monobank