
Your on-call rotation exists because Prometheus detects the problem in 30 seconds but nobody automated the fix — Alertmanager self-healing with Bash closes that gap without requiring Kubernetes or a commercial platform. I’ve run this pattern on bare-metal fleets, mixed VM environments, and hybrid setups where dropping a full k8s stack wasn’t on the table. Done right, it handles 80% of the repetitive 2 AM pages. Done wrong, it turns one incident into three.
This post walks through the full architecture: how the alerting chain actually works internally, the mistakes that cause alert storms and infinite loops, the production-grade implementation with lockfiles and circuit breakers, and the security surface you cannot ignore.
What This Actually Does

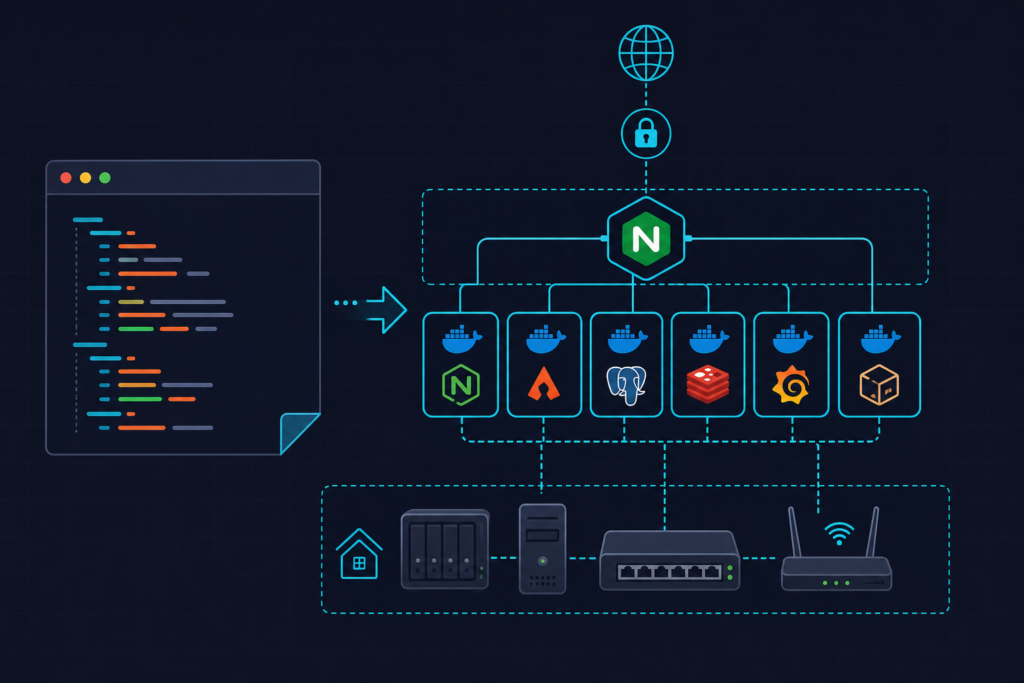
The mechanism is straightforward once you strip away the marketing language. Prometheus evaluates an alerting rule — say, up{job="nginx"} == 0 — and after the for: 2m window, it pushes the alert to Alertmanager. Alertmanager routes it through a route tree, matches a receiver tagged heal: "true", and fires an HTTP POST to a webhook_configs URL. That URL is a small listener running on 127.0.0.1:9095. The listener parses the JSON payload, identifies the alert name and instance, and executes a scoped Bash handler script. The service restarts, disk gets drained, process count scales — whatever the runbook says.
That’s the entire chain: Alertmanager → webhook POST → listener → Bash handler. No magic. Just automated runbooks with a trigger mechanism.
This is deliberately different from Kubernetes liveness probes. Probes operate at the container scheduler level and only restart containers. The pattern here targets anything that isn’t in a k8s cluster — bare-metal Nginx, a VM-hosted PostgreSQL replica, a legacy Java service on an EC2 instance with no ECS wrapper. The webhook approach works anywhere you can run a process and receive HTTP on loopback.
One important detail: Alertmanager 0.26+ supports max_alerts: 1 in webhook_configs. Setting this means each POST contains exactly one alert, which massively simplifies handler logic. Without it, you get batched payloads with an alerts[] array of unpredictable length, and your script needs to loop correctly or it silently skips alerts. Set max_alerts: 1 and process each alert individually. You can always reference the official Alertmanager webhook configuration docs for the full payload schema.
How People Wire This Up Wrong
I’ve seen this pattern deployed badly more times than correctly. Three mistakes come up constantly.
Mistake 1: No idempotency guards. The remediation script runs directly as the webhook receiver without any locking. Alertmanager sends the first notification, the script starts restarting Nginx, and 30 seconds later — because group_interval is short — Alertmanager fires again. Now you have two concurrent restart attempts on the same service. The second one catches the service mid-start, the health check fails, and the alert stays firing. The script runs a third time. You’ve turned a 10-second outage into a 3-minute incident.
Mistake 2: Not filtering on status: resolved. Alertmanager sends a second POST when the alert clears, with "status": "resolved". Scripts that don’t check this will execute the remediation handler on resolution — restarting a service that just recovered cleanly on its own. I’ve watched this cause a database connection pool to reset 30 seconds after a brief network blip, dropping every active connection unnecessarily. Always check [[ "$STATUS" == "firing" ]] || exit 0 at the top of every handler.
Mistake 3: Running the listener as root with no input validation. The webhook endpoint receives arbitrary JSON. If your Alertmanager config is misconfigured or someone sends a crafted payload, an unvalidated alertname field gets interpolated into a shell command path like /opt/heal/handlers/${alertname}.sh. With path traversal or shell metacharacters, that becomes a serious problem. The listener must run as a dedicated healer service account, validate every extracted field against a whitelist, and never interpolate raw JSON values directly into shell commands.
Watch out for this timing trap: if you set repeat_interval: 5m in Alertmanager but your remediation script takes 6 minutes to complete, the alert re-fires before the script exits. The lockfile is still held, so the second invocation skips — but the attempt counter increments, and your circuit breaker may trip prematurely. Match your repeat_interval to the realistic worst-case execution time of your slowest handler, with headroom.
The Correct Approach: Webhook Listener and Guarded Remediation Scripts
Here’s the production architecture I use. A socat-based loop handles incoming connections and forks a Bash function for each request. Each handler runs under flock with a per-alertname lock file. A circuit breaker tracks attempt counts per alert fingerprint using a state file in /tmp. Every action writes to both a local log file and syslog via logger -t self-heal.
The listener script below handles JSON validation, status filtering, instance whitelisting, circuit breaking, and locked execution in under 100 lines:
#!/usr/bin/env bash
# /opt/self-heal/webhook-listener.sh
# Minimal self-healing webhook listener for Alertmanager
# Requires: jq, flock, socat
# Run as: systemd service under 'healer' user
# Tested with Alertmanager 0.26, Prometheus 2.48

set -euo pipefail

LISTEN_PORT="${HEAL_PORT:-9095}"
LOG_DIR="/var/log/self-heal"
LOCK_DIR="/var/lock/self-heal"
SCRIPT_DIR="/opt/self-heal/handlers"
MAX_ATTEMPTS=3

mkdir -p "$LOG_DIR" "$LOCK_DIR"

log() {
  local level="$1"; shift
  # Write to local log file AND syslog so actions survive log rotation
  echo "$(date -u +%Y-%m-%dT%H:%M:%SZ) [$level] $*" | tee -a "$LOG_DIR/listener.log"
  logger -t self-heal "[$level] $*"
}

handle_request() {
  # Read HTTP POST body from stdin (passed by socat)
  local body
  body=$(cat)

  # Validate it looks like JSON before processing
  if ! echo "$body" | jq empty 2>/dev/null; then
    log ERROR "Invalid JSON payload received"
    printf 'HTTP/1.1 400 Bad Request\r\nContent-Length: 0\r\n\r\n'
    return
  fi

  # Process each alert individually even if batched
  local alert_count
  alert_count=$(echo "$body" | jq '.alerts | length')

  for i in $(seq 0 $((alert_count - 1))); do
    local status alertname instance fingerprint
    status=$(echo "$body"      | jq -r ".alerts[$i].status")
    alertname=$(echo "$body"   | jq -r ".alerts[$i].labels.alertname")
    instance=$(echo "$body"    | jq -r ".alerts[$i].labels.instance")
    fingerprint=$(echo "$body" | jq -r ".alerts[$i].fingerprint")

    # Only act on firing alerts — ignore resolved status entirely
    [[ "$status" == "firing" ]] || { log INFO "Skipping resolved alert: $alertname"; continue; }

    # Validate instance against known hosts (whitelist file, one host per line)
    if ! grep -qF "$instance" /opt/self-heal/allowed-instances.txt 2>/dev/null; then
      log WARN "Instance not in whitelist, skipping: $instance"
      continue
    fi

    local handler="$SCRIPT_DIR/${alertname}.sh"
    if [[ ! -x "$handler" ]]; then
      log WARN "No handler found for alert: $alertname"
      continue
    fi

    # Circuit breaker: track attempt count per fingerprint using short hash
    # Short hash prevents filename length issues with long fingerprints
    local short_fp attempt_file attempts
    short_fp=$(echo "$fingerprint" | sha256sum | cut -c1-8)
    attempt_file="/tmp/heal-attempts-${short_fp}"
    attempts=$(cat "$attempt_file" 2>/dev/null || echo 0)

    if (( attempts >= MAX_ATTEMPTS )); then
      log ERROR "Circuit breaker tripped for $alertname on $instance (attempts: $attempts)"
      # POST to PagerDuty Events API v2 here when threshold exceeded
      continue
    fi

    echo $((attempts + 1)) > "$attempt_file"

    # flock -n: non-blocking — if lock is held, skip rather than queue
    local lock_file="$LOCK_DIR/heal-${alertname}.lock"
    log INFO "Triggering handler: $alertname for $instance (attempt $((attempts + 1)))"

    flock -n "$lock_file" bash "$handler" "$instance" "$alertname" "$fingerprint" \
      >> "$LOG_DIR/${alertname}.log" 2>&1 \
      && { log INFO "Handler succeeded: $alertname"; rm -f "$attempt_file"; } \
      || log ERROR "Handler failed: $alertname exit=$?"
  done

  printf 'HTTP/1.1 200 OK\r\nContent-Length: 0\r\n\r\n'
}

export -f handle_request log
log INFO "Self-heal listener starting on 127.0.0.1:${LISTEN_PORT}"

# socat loop: handles one connection per fork, safe for low-volume alert traffic
# bind=127.0.0.1 is critical — never expose this on 0.0.0.0
exec socat TCP-LISTEN:"${LISTEN_PORT}",bind=127.0.0.1,reuseaddr,fork \
  EXEC:"bash -c handle_request",nofork
The Alertmanager configuration that feeds this listener uses group_by: [alertname, instance] so alerts for different instances don’t collapse together, and repeat_interval: 4h to match the circuit breaker window. The heal: "true" label on the Prometheus alerting rule is what routes the alert to the self-heal receiver rather than your default notification channel.
# /etc/alertmanager/alertmanager.yml
# Alertmanager 0.26.x — wired to self-heal webhook listener

global:
  resolve_timeout: 5m

route:
  receiver: "default-null"
  group_by: [alertname, instance]  # separate groups per instance prevents cross-host collisions
  group_wait: 30s
  group_interval: 5m
  repeat_interval: 4h              # must exceed worst-case handler execution time

  routes:
    # Only self-heal alerts tagged with heal="true" label in Prometheus rules
    - match:
        heal: "true"
      receiver: self-heal-webhook
      group_wait: 10s
      repeat_interval: 4h
      continue: false              # do not fall through to default receiver

receivers:
  - name: "default-null"
    # intentionally empty

  - name: self-heal-webhook
    webhook_configs:
      - url: "http://127.0.0.1:9095"
        send_resolved: true        # listener handles status=resolved with early exit
        max_alerts: 1             # one alert per POST — simplifies handler routing
        http_config:
          follow_redirects: false

inhibit_rules:
  # Suppress self-healing attempts when the entire node is unreachable
  # Prevents healing scripts from trying to restart services on a dead host
  - source_match:
      alertname: NodeDown
    target_match:
      heal: "true"
    equal: [instance]

# Example Prometheus alerting rule that triggers self-healing:
#
# groups:
#   - name: self-heal
#     rules:
#       - alert: NginxDown
#         expr: up{job="nginx"} == 0
#         for: 2m                    # minimum 2m to avoid healing transient scrape gaps
#         labels:
#           severity: critical
#           heal: "true"             # this label routes to self-heal receiver
#         annotations:
#           summary: "Nginx down on {{ $labels.instance }}"
After editing alertmanager.yml, reload without restart: curl -X POST http://localhost:9093/-/reload. This has worked since Alertmanager 0.15 and there’s no reason to bounce the process.
The inhibit_rules block is something I consider non-negotiable. If NodeDown fires for an instance, every healing attempt for that instance is suppressed. Without this, your listener will try to restart Nginx on a host that isn’t responding to SSH, log a failure, increment the attempt counter, and trip the circuit breaker — wasting the three attempts you’d need once the host comes back.
Advanced Patterns: Escalation Chains and Rollback Guards
The circuit breaker in the listener script above handles the “what if healing doesn’t work” question at a basic level. But production environments need more structure around failure escalation.
When the attempt counter hits MAX_ATTEMPTS, the listener currently logs and skips. In real deployments, that skip should trigger a POST to PagerDuty Events API v2 with the fingerprint, attempt count, and last exit code in the payload. This creates a clean handoff: automated remediation tried, failed three times, now a human gets paged with full context rather than a raw Prometheus alert with no history.
The rollback guard pattern adds another layer. Before any handler executes a destructive action — restarting a service, modifying a config file, draining a disk — it snapshots the current state to /var/backups/self-heal/$(date +%s)-${alertname}/. If the handler exits non-zero, a cleanup function restores from that snapshot. I’ve used this specifically for handlers that modify nginx.conf to adjust worker counts: if the config edit produces an invalid file and Nginx refuses to reload, the handler catches the exit code and restores the previous config automatically.
Exit codes matter more than most Bash scripts acknowledge. I standardize on: exit 0 for clean success (clears the attempt counter), exit 1 for recoverable failure (increments counter, retry allowed), exit 2 for circuit-breaker trip (escalate immediately, no retry). The listener interprets each differently, which gives you a three-tier response system without any additional tooling.
For teams managing more than a handful of hosts, storing attempt state in /tmp files becomes fragile — a host reboot clears all state and resets circuit breakers. Consider writing attempt state to a shared Redis instance or even a simple SQLite file on persistent storage if you need state to survive reboots. For most use cases, /tmp is fine because a rebooted host means the alert clears and the attempt counter is legitimately reset anyway.
Performance and Security Notes
The socat fork-per-connection model works well under normal alert volumes — a few dozen events per hour. Under alert storms, it becomes a problem. If 50 alerts fire simultaneously (a network partition, a bad deploy), socat forks 50 processes, each spawning jq, each trying to acquire locks, each writing to logs. The host will survive, but you’ll see CPU spikes and potentially delayed responses that cause Alertmanager to retry.
The correct mitigation is at the Alertmanager level, not the listener level. Use inhibit_rules aggressively to suppress downstream alerts when a root cause is identified. Use group_interval to batch related alerts. If you genuinely need high-throughput webhook processing, replace the socat listener with a minimal Python http.server implementation that pushes to an internal queue before responding — keep the HTTP response fast and process the queue asynchronously.
Watch out for this security mistake: binding the listener to 0.0.0.0 instead of 127.0.0.1. I’ve seen this in at least four different infrastructure repos. Anyone who can reach port 9095 on that host can POST arbitrary JSON and trigger remediation scripts. The bind=127.0.0.1 argument in the socat command is not optional. If you need the listener accessible from another host — for example, if Alertmanager runs on a separate server — put it behind an mTLS proxy or an internal load balancer with IP allowlisting, not a raw open port.
The healer service account needs exactly one privilege: the ability to run specific commands via sudo. The /etc/sudoers.d/healer file should list each allowed command explicitly — NOPASSWD: /bin/systemctl restart nginx, not NOPASSWD: ALL. I stopped using broad sudo grants after an incident where a misconfigured handler script, combined with a too-permissive sudoers entry, restarted a database service during a backup window. Explicit command lists are the only safe option.
For audit trails, the logger -t self-heal calls in the listener ensure every remediation action appears in your centralized logging pipeline — whether that’s CloudWatch Logs, Loki, or a syslog forwarder. Local log files in /var/log/self-heal/ are useful for quick debugging but should use logrotate with the copytruncate option. Standard rotation renames the file while the script still has the old file descriptor open, and you lose log entries until the next listener restart. copytruncate truncates in place and keeps the file handle valid. You can read more about building complete observability around this kind of infrastructure automation at kuryzhev.cloud.
The Prometheus alerting rule itself deserves one final note: always set for: 2m minimum before firing. A for: 0s rule fires on every scrape anomaly — a single missed scrape, a 200ms timeout, a GC pause that delays the metrics endpoint. You will restart services that don’t need restarting, accumulate attempt counter increments, and exhaust your circuit breaker budget on phantom alerts. Two minutes filters out the transient noise that every production system generates constantly.
This entire pattern — Prometheus alerting rule with heal: "true" label, Alertmanager routing to a loopback webhook, a locked Bash listener with circuit breaking, and a dedicated low-privilege service account — gives you automated incident response that’s auditable, reversible, and safe to run in production. It’s not a replacement for fixing the root cause. It’s the difference between waking someone up to type systemctl restart nginx at 3 AM and having that happen automatically while the on-call engineer sleeps through it.