Your on-call engineer just got paged at 3 AM — what if Slack already had a two-paragraph incident summary, three immediate actions, and a runbook link waiting before they even opened their laptop. That is exactly what n8n AI agent incident automation delivers. Instead of digging through six Slack threads, two Grafana dashboards, and a stale Confluence page, the engineer reads a structured brief, picks the first action item, and starts fixing — all within 90 seconds of the alert firing.
The Scenario
We have all lived this. PagerDuty fires at 3:14 AM. You stumble to your laptop, open Slack, and the only context you have is HighErrorRate on payments-api-prod. You start hunting. Check Grafana. Switch to Loki. Search Slack history for the last time this alert fired. Eventually find a runbook that was last updated eight months ago by someone who no longer works here. By the time you understand what is actually on fire, twenty minutes have passed and your SLO burn rate has doubled.
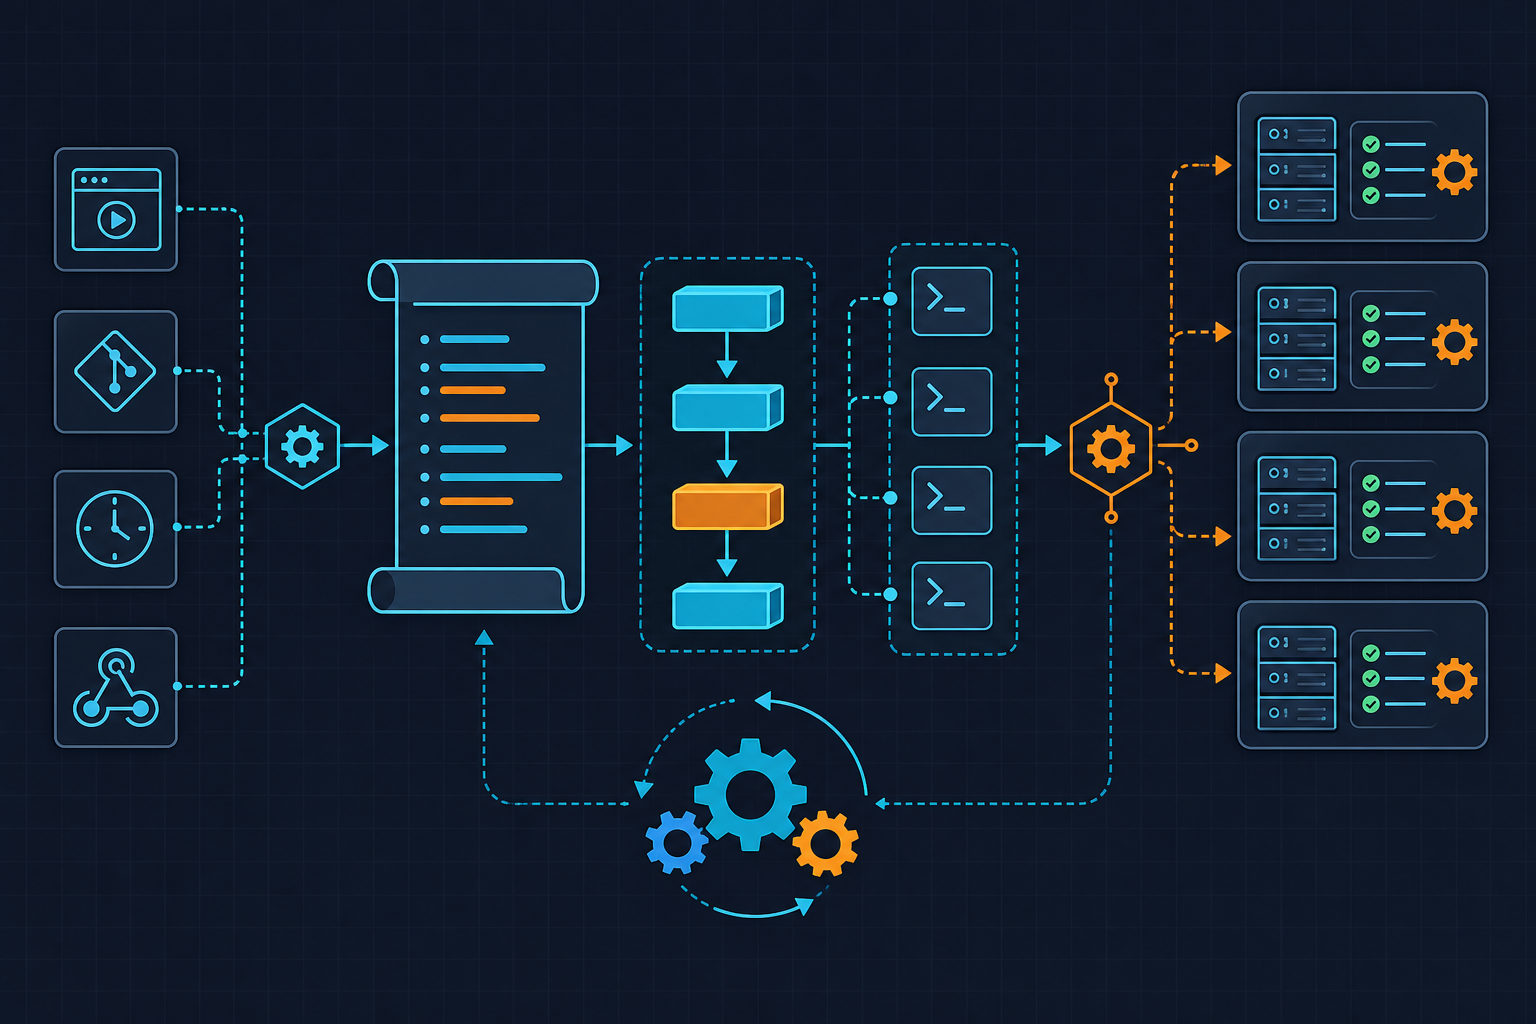
The workflow we are building changes that entirely. Here is what the finished setup does: Alertmanager fires a webhook to n8n the moment an alert transitions to firing state. n8n extracts the alert context, queries Loki for the last 15 minutes of logs from the affected instance, pulls the current error rate from Prometheus, feeds everything into a gpt-4o prompt with a strict output schema, and posts a formatted Block Kit message to the right Slack channel — all before you have found your glasses.
Scope for this tutorial: we are covering the Alertmanager → n8n → OpenAI → Slack path end to end. PagerDuty can replace Alertmanager as the webhook source with minimal changes to the parse step, but I am not building that variant out here. The principles are identical.
Prerequisites
Before you start wiring nodes together, make sure you have these pieces in place. Missing any one of them mid-tutorial is a guaranteed time sink.
- n8n self-hosted v1.40+ running via Docker Compose, or an n8n Cloud account. The stable LangChain AI Agent node with a reliable Output Parser sub-node shipped in v1.40.0. Earlier versions have the node but the Output Parser is flaky — I burned two hours on v1.38 before I checked the changelog. Use the official image:
docker.n8n.io/n8nio/n8n:1.40.0. Mount/home/node/.n8nas a named volume so your workflows and credentials survive container restarts. - OpenAI API key with access to
gpt-4o. Scope this key to a dedicated project in the OpenAI dashboard and set a monthly spend cap of $10. At roughly $0.0045 per 3,000-token incident summary you are looking at under $1.00 for 200 alerts per month — negligible. But a runaway alert storm of 1,000+ alerts per hour without a severity filter can spike to $50+ fast. A compromised n8n instance with an uncapped key is a real financial risk. Cap it. - Slack bot token with
chat:writeandchannels:readscopes. Note the channel IDs (not names) for your#incidentsand#on-call-alertschannels — the Slack API routes by ID, not display name. - Alertmanager webhook receiver already configured in your
alertmanager.yml, or acurlcommand ready to simulate the payload (provided in the Verify section). You also need HTTP access from n8n to your Loki instance (/loki/api/v1/query_range) and Prometheus (/api/v1/query). - Assumed knowledge: basic n8n workflow navigation and familiarity with Prometheus alert labels. You do not need to know LangChain internals — n8n abstracts it.
For the official n8n AI Agent node documentation, see the n8n LangChain Agent reference. For Alertmanager webhook configuration, the Prometheus Alertmanager webhook_config docs cover the payload format we parse in Step 1.
Step 1 — Ingest the Alert Webhook and Extract Context
The entry point of the workflow is a Webhook node. Configure it at path /incident-summary with HTTP method POST. Set Authentication to Header Auth and point it at an n8n Header Auth credential — never hardcode the secret inline. The credential stores it AES-256 encrypted at rest. Do not pass the secret as a query parameter: it will appear in n8n execution logs in plaintext. Use the X-Webhook-Secret header.
Watch out for this: Enable “Respond to Webhook” immediately in the Webhook node settings. If n8n does not return a 200 within 5 seconds, Alertmanager retries 3 times over 30 seconds. Without immediate response enabled, you will get duplicate Slack messages on every alert. I have seen this flood a channel with 12 identical summaries during a high-cardinality firing event.
After the Webhook node, a Code node (JavaScript) normalizes the payload. The most common parsing bug I see: forgetting that Alertmanager always wraps alerts in an alerts[] array, even for a single alert. Always iterate the array. The code below handles both single and grouped payloads and builds the Loki time window in nanoseconds:
# n8n workflow export snippet — core nodes only
# Compatible with n8n v1.40+
# Import via: Settings > Import Workflow in n8n UI

nodes:
  - name: "Incident Webhook"
    type: "n8n-nodes-base.webhook"
    parameters:
      path: "incident-summary"
      httpMethod: "POST"
      authentication: "headerAuth"
      # Credential: create "Header Auth" credential named "alertmanager-webhook-secret"
      # Header name: X-Webhook-Secret
    position: [240, 300]

  - name: "Parse Alert Payload"
    type: "n8n-nodes-base.code"
    parameters:
      language: "javaScript"
      jsCode: |
        // Alertmanager always wraps in alerts[] — even single alerts
        const alerts = $input.item.json.alerts || [];
        const alert = alerts[0]; // process first; use SplitInBatches for grouped

        if (!alert) throw new Error("Empty alerts array received from Alertmanager");

        return [{
          json: {
            alertname:   alert.labels?.alertname   ?? "unknown",
            severity:    alert.labels?.severity    ?? "unknown",
            instance:    alert.labels?.instance    ?? "unknown",
            namespace:   alert.labels?.namespace   ?? "default",
            startsAt:    alert.startsAt,
            description: alert.annotations?.description ?? "No description provided",
            // 15-minute lookback window in nanoseconds for Loki query
            endNs:   String(Date.now() * 1e6),
            startNs: String((Date.now() - 15 * 60 * 1000) * 1e6),
          }
        }];
    position: [460, 300]

  - name: "Skip Low Severity"
    type: "n8n-nodes-base.if"
    parameters:
      conditions:
        string:
          - value1: "={{ $json.severity }}"
            operation: "notEqual"
            value2: "warning"   # Only process critical and high — blocks LLM cost bleed
    position: [680, 300]
The IF node is your cost guard. Warning-level alerts are often noise — transient spikes, self-resolving conditions, things that fire and resolve before anyone reads them. Sending those through the LLM pipeline wastes tokens and trains your on-call team to ignore the Slack summaries. Filter them out here, not later.
Step 2 — Query Live Log and Metric Context
This is the step that separates a useful AI summary from a hallucinated one. If you hand the LLM only the alert label, it will produce generic advice. Feed it real logs and real metric values and it produces something an engineer can actually act on.
Use an HTTP Request node to hit Loki’s query range endpoint. Build the LogQL expression dynamically from the extracted instance label. Set direction=forward in the query parameters — Loki returns newest-first by default, and if you inject log lines in reverse chronological order the LLM reads the story backwards and the probable cause analysis suffers. Setting direction=forward in the request saves you a manual array reversal in a Code node. Cap returned lines at 50 with the limit parameter — 50 lines is enough signal and keeps your token count manageable.
Run a second HTTP Request node in parallel to query Prometheus for the current error rate. Use the instant query endpoint at /api/v1/query. I also pull latency p99 in a third query when the alert is latency-related — two HTTP nodes in parallel, merged after.
Merge both responses using a Merge node in combine / mergeByPosition mode. Wire a fallback path from each HTTP node to a Slack warning message in case either query returns empty data. Do not let the workflow crash silently if Loki is down — post a degraded-context warning to Slack and continue with whatever data you have. An AI summary with partial context is still better than no summary.
  - name: "Query Loki Logs"
    type: "n8n-nodes-base.httpRequest"
    parameters:
      method: "GET"
      url: "http://loki:3100/loki/api/v1/query_range"
      queryParameters:
        parameters:
          - name: "query"
            value: '={{ `{instance="${$json.instance}"}` }}'
          - name: "start"
            value: "={{ $json.startNs }}"
          - name: "end"
            value: "={{ $json.endNs }}"
          - name: "limit"
            value: "50"       # Hard cap — controls downstream token usage
          - name: "direction"
            value: "forward"  # Chronological order; avoids manual array reversal
    position: [900, 200]

  - name: "Query Prometheus"
    type: "n8n-nodes-base.httpRequest"
    parameters:
      method: "GET"
      url: "http://prometheus:9090/api/v1/query"
      queryParameters:
        parameters:
          - name: "query"
            value: '={{ `rate(http_requests_total{instance="${$json.instance}"}[5m])` }}'
    position: [900, 400]

  - name: "Merge Context"
    type: "n8n-nodes-base.merge"
    parameters:
      mode: "combine"
      combinationMode: "mergeByPosition"
    position: [1120, 300]
Step 3 — Call the AI Agent and Generate the Summary
Now we get to the part that actually does the thinking. Use the n8n AI Agent node (LangChain-backed, available and stable from v1.40+) with model set to gpt-4o.
Critical setting — temperature: Set it to 0.1. Not 0.7, not the default. I made this mistake on the first build and the output parser failed on roughly one in five executions because the model produced slightly different JSON structures across calls. At 0.1 the output is deterministic enough that the schema validator passes consistently. Higher temperatures are great for creative tasks. For structured incident summaries at 3 AM, you want boring and predictable.
The system prompt enforces a strict output schema. Enable the Output Parser sub-node and provide the JSON schema there. This forces structured output at the API level, not just via prompt instruction. Keep your total prompt under 3,000 tokens — gpt-4o has a 128K context window but response quality for JSON-constrained outputs degrades meaningfully beyond 8K input tokens, and latency spikes above 8 seconds start making Alertmanager retry windows uncomfortable.
The runbook matching is intentionally simple: a JSON lookup table stored as an n8n Static Data variable ($getWorkflowStaticData('global')). This persists across executions without a database and is practical up to around 200 KB of JSON — enough for 50+ runbook mappings. No need for a vector database for a first version. We ask the LLM to return a runbook_hint field (the alert name or component keyword), then look that up against the table in a Code node before the Slack step.
Step 4 — Post to Slack with Runbook Deep-Link
The Slack message is the product. Everything else is infrastructure. Format it for someone who is half-asleep and needs to make a decision in 30 seconds.
Use Block Kit. A plain text message is fine for casual notifications — for incident summaries at 3 AM, the visual hierarchy of Block Kit is worth the extra configuration. The structure I use: one header block with alert name and severity, one section block with the AI summary and probable cause, one section block with the numbered immediate actions, one context block with deep-links to Loki and Prometheus for the specific instance, and one button block linking to the matched runbook.
Watch out for this: The Slack button element requires an action_id field. Omitting it returns a 400 invalid_blocks error from the Slack API. It is not documented prominently and it will silently fail your message delivery. Always include it.
Route the message dynamically: if severity === "critical", post to your #incidents channel ID; otherwise post to #on-call-alerts. Store the runbook lookup table as Static Data and resolve the runbook URL before the Slack node runs. No manual routing configuration needed.
// Slack Block Kit payload — paste into n8n Slack node "Blocks" field
// Replace {{ expressions }} with n8n expression syntax in the actual node
[
  {
    "type": "header",
    "text": {
      "type": "plain_text",
      "text": "🔴 CRITICAL: {{ $json.alertname }} on {{ $json.instance }}"
    }
  },
  {
    "type": "section",
    "text": {
      "type": "mrkdwn",
      "text": "*Summary*\n{{ $json.aiOutput.incident_summary }}\n\n*Probable Cause*\n{{ $json.aiOutput.probable_cause }}"
    }
  },
  {
    "type": "section",
    "text": {
      "type": "mrkdwn",
      "text": "*Immediate Actions*\n1. {{ $json.aiOutput.immediate_actions[0] }}\n2. {{ $json.aiOutput.immediate_actions[1] }}\n3. {{ $json.aiOutput.immediate_actions[2] }}"
    }
  },
  {
    "type": "context",
    "elements": [
      {
        "type": "mrkdwn",
        "text": "<http://grafana:3000/explore|📊 Loki Logs>  |  <http://prometheus:9090/graph|📈 Prometheus>"
      }
    ]
  },
  {
    "type": "actions",
    "elements": [
      {
        "type": "button",
        "action_id": "open_runbook",
        "text": {
          "type": "plain_text",
          "text": "📖 Open Runbook"
        },
        "url": "https://wiki.example.com/runbooks/{{ $json.aiOutput.runbook_hint }}",
        "style": "primary"
      }
    ]
  }
]
Verify and Test
Do not wait for a real incident to find out the workflow is broken. Use this curl command to POST a synthetic Alertmanager payload directly to your webhook URL. Replace YOUR_N8N_HOST and YOUR_SECRET with your actual values:
curl -X POST https://YOUR_N8N_HOST/webhook/incident-summary \
  -H "Content-Type: application/json" \
  -H "X-Webhook-Secret: YOUR_SECRET" \
  -d '{
    "alerts": [
      {
        "labels": {
          "alertname": "HighErrorRate",
          "severity": "critical",
          "instance": "payments-api-prod:8080",
          "namespace": "production"
        },
        "annotations": {
          "description": "Error rate on payments-api-prod exceeded 5% for 3 consecutive minutes."
        },
        "startsAt": "2024-06-13T03:14:00Z"
      }
    ]
  }'
After running this, open the n8n execution log for the workflow. Check each node’s output in sequence. The Parse Alert Payload node should show the extracted fields. The Loki and Prometheus HTTP nodes should return data (or trigger the fallback path if those services are not reachable from your test environment). The AI Agent node output should be valid JSON matching your schema — four keys, no markdown fences, no prose outside the object.
Then deliberately break something. Comment out the Loki endpoint or point it at a non-existent host. Re-run the curl command. Confirm that the fallback Slack warning node fires and the workflow does not silently crash. Silent failures in on-call tooling are worse than no tooling — you think you have coverage and you do not.
If you hit "Workflow could not be activated: Webhook URL already registered", you have another workflow using the same path. Rename one to /incident-summary-v2. This happens more often than you would think when iterating on workflow versions.
End-to-end latency from webhook receipt to Slack message should be under 10 seconds on a normal OpenAI response time. If you are consistently hitting 15+ seconds, check your log query — a slow Loki response is usually the culprit, not the LLM call.
This workflow is a practical starting point that a small on-call team can own without a dedicated platform engineering headcount. What we built is an Alertmanager-triggered n8n pipeline that queries real telemetry, generates a structured AI brief via gpt-4o, and delivers it to the right Slack channel before the engineer has context-switched into incident mode. The natural next extension is replacing the static runbook lookup table with vector-search retrieval against your full runbook corpus — Pinecone or a local pgvector instance both work well as an n8n HTTP node target. Longer term, a fine-tuned model on your historical incident resolutions will outperform the general-purpose prompt for your specific stack. But the reason I keep the LLM call inside n8n rather than building a custom Lambda or FastAPI service is operational simplicity: one place to update the prompt, one credential store, one execution log, and zero additional infrastructure for a team that is already stretched thin on on-call rotations. You can explore more automation patterns at kuryzhev.cloud.