Overview
EventBridge retry policies and DLQ handling in production on AWS address a failure mode that rarely announces itself: events that simply vanish when a downstream target is unavailable, throttled, or returns an error. Unlike synchronous API calls, where a failed request surfaces immediately, EventBridge delivery failures are asynchronous — and if you have not explicitly configured retry behavior and a dead letter queue, the default settings will quietly exhaust retries over up to 24 hours and 185 attempts before discarding the event entirely.
That default behavior is the most common silent-loss trap in production event-driven systems. A Lambda function that is cold-starting under heavy load, an SQS target that briefly hits its throughput limit, or a downstream service undergoing a deployment — any of these can cause EventBridge to enter its default retry window without you ever knowing. By the time the window closes, the original event is gone, with no trace in your logs unless you have instrumented for it.
This tutorial covers the full production setup: scoping retry windows to match your SLA, provisioning an SQS dead letter queue with the correct resource policy, wiring it to the rule target (not the bus — a distinction that trips up many teams), and building CloudWatch alarms so a non-empty DLQ surfaces as an actionable alert rather than a silent backlog.
For related patterns on handling failed async events, see the AWS Lambda dead letter queues with SQS post on this site, which covers the Lambda-side of the same failure domain.
Before You Start
Before working through the steps below, confirm the following are in place:
- AWS account and region: You need access to the account where the EventBridge bus and target resources live. Cross-account setups require additional trust policies not covered here.
- IAM permissions: Your deployment principal needs
events:PutRule,events:PutTargets,sqs:CreateQueue,sqs:SetQueueAttributes, andcloudwatch:PutMetricAlarm. If you are using Terraform, the same applies to the role runningterraform apply. - Existing EventBridge custom bus: The examples use a bus named
orders-bus. If you are working with the default bus, replaceevent_bus_namevalues accordingly. - Terraform 1.5+ or AWS CLI v2: The IaC examples use
aws_cloudwatch_event_targetwith nestedretry_policyanddead_letter_configblocks. CLI examples use theaws eventssubcommand. - An SNS topic for alerts: The CloudWatch alarm in Step 3 publishes to an SNS topic ARN passed as
var.sns_alert_topic_arn.
Refer to the EventBridge targets documentation for the full list of supported target types and their delivery semantics before you begin.
Step 1: Configure the Retry Policy on EventBridge Rule Targets

The retry policy lives on the target, not on the rule or the bus. This distinction matters both conceptually and practically — each target on a given rule can have a different retry window, which lets you tune aggressively for a latency-sensitive Lambda while being more permissive for a batch SQS target on the same rule.
The two parameters you control are MaximumRetryAttempts (0–185) and MaximumEventAgeInSeconds (60–86400). In most production scenarios, the default values — 185 attempts over 24 hours — are far too broad. A downstream service that is down for more than a few minutes is usually a signal to route the event to a DLQ for human review, not to silently retry for hours.
A reasonable starting point for a transactional workload is three attempts over five minutes. If the target has not recovered in that window, the event should land in the DLQ where it can be inspected and replayed deliberately.
Using the CLI, you can set the retry policy when calling put-targets:
aws events put-targets \
  --rule orders-created-rule \
  --event-bus-name orders-bus \
  --targets "Id=OrderProcessorLambda,Arn=arn:aws:lambda:us-east-1:123456789012:function:order-processor,\
RetryPolicy={MaximumRetryAttempts=3,MaximumEventAgeInSeconds=300}"
To verify the configuration was applied correctly, use list-targets-by-rule and inspect the RetryPolicy block in the response:
aws events list-targets-by-rule \
  --rule orders-created-rule \
  --event-bus-name orders-bus
If the RetryPolicy key is absent from the output, the target is still using the 24-hour default. This is the most common oversight when migrating existing rules to a hardened configuration.
Step 2: Provision and Attach a Dead Letter Queue to the Target
Once the retry window is exhausted — or if EventBridge receives a non-retryable error code from the target — it needs somewhere to send the failed event. Without a DLQ attached, the event is silently discarded. With one attached, you get a recoverable artifact: the original event payload plus metadata about why delivery failed.
The SQS resource policy is the step where most teams encounter problems. EventBridge must be granted sqs:SendMessage on the DLQ, and the principal must be events.amazonaws.com. Omitting this policy, or attaching it to the wrong queue, causes PutTarget to succeed but delivery to fail silently — EventBridge will not surface a clear error at rule creation time.
The Terraform configuration below provisions the DLQ, attaches the correct resource policy, and wires everything to the rule target in a single configuration file:
# eventbridge_retry_dlq.tf
# Provisions an EventBridge rule with retry policy and SQS DLQ

resource "aws_sqs_queue" "event_dlq" {
  name                       = "orders-events-dlq"
  message_retention_seconds  = 1209600 # 14 days
  visibility_timeout_seconds = 60
}

resource "aws_sqs_queue_policy" "event_dlq_policy" {
  queue_url = aws_sqs_queue.event_dlq.id

  policy = jsonencode({
    Version = "2012-10-17"
    Statement = [
      {
        Sid       = "AllowEventBridgeSend"
        Effect    = "Allow"
        Principal = { Service = "events.amazonaws.com" }
        Action    = "sqs:SendMessage"
        Resource  = aws_sqs_queue.event_dlq.arn
        Condition = {
          ArnEquals = {
            "aws:SourceArn" = aws_cloudwatch_event_rule.orders_rule.arn
          }
        }
      }
    ]
  })
}

resource "aws_cloudwatch_event_rule" "orders_rule" {
  name           = "orders-created-rule"
  event_bus_name = "orders-bus"
  event_pattern = jsonencode({
    source      = ["com.myapp.orders"]
    detail-type = ["OrderCreated"]
  })
}

resource "aws_cloudwatch_event_target" "orders_lambda_target" {
  rule           = aws_cloudwatch_event_rule.orders_rule.name
  event_bus_name = "orders-bus"
  arn            = aws_lambda_function.order_processor.arn
  target_id      = "OrderProcessorLambda"

  retry_policy {
    maximum_retry_attempts       = 3
    maximum_event_age_in_seconds = 300
  }

  dead_letter_config {
    arn = aws_sqs_queue.event_dlq.arn
  }
}

resource "aws_cloudwatch_metric_alarm" "dlq_not_empty" {
  alarm_name          = "orders-dlq-messages-visible"
  namespace           = "AWS/SQS"
  metric_name         = "ApproximateNumberOfMessagesVisible"
  dimensions          = { QueueName = aws_sqs_queue.event_dlq.name }
  statistic           = "Sum"
  period              = 60
  evaluation_periods  = 1
  threshold           = 1
  comparison_operator = "GreaterThanOrEqualToThreshold"
  alarm_actions       = [var.sns_alert_topic_arn]
}
Pay attention to the visibility_timeout_seconds on the DLQ. If you later build a Lambda-based replay consumer for this queue, the visibility timeout must be set higher than the Lambda function’s execution timeout — otherwise a slow replay attempt will cause the message to become visible again mid-processing, leading to duplicate deliveries.
After applying, confirm the DLQ ARN appears on the target:
aws events list-targets-by-rule \
  --rule orders-created-rule \
  --event-bus-name orders-bus \
  --query "Targets[*].{ID:Id,DLQ:DeadLetterConfig.Arn}"
Step 3: Monitor, Alert, and Replay DLQ Messages
A DLQ that nobody watches is only marginally better than no DLQ at all. The CloudWatch alarm provisioned in the Terraform above fires as soon as a single message appears in the queue, which is the right threshold for transactional event streams — any DLQ message represents a delivery failure that needs a human decision.
When the alarm fires, the first step is to inspect the failed event payload. Use receive-message with --attribute-names All to retrieve both the event body and the SQS system attributes, which include the approximate receive count and the original send timestamp:
aws sqs receive-message \
  --queue-url https://sqs.us-east-1.amazonaws.com/123456789012/orders-events-dlq \
  --attribute-names All \
  --message-attribute-names All \
  --max-number-of-messages 1
The response body will contain the original EventBridge event JSON. The ErrorCode and ErrorMessage fields in the SQS message attributes explain why delivery failed — for example, MessageRejected for a Lambda that returned a 4xx, or InternalException for a transient AWS-side error.
For replay, you have two practical options. The first is an EventBridge Pipe that reads from the DLQ and routes messages back to the original bus or directly to the target. The second is a purpose-built Lambda function that reads the DLQ in batches, re-invokes the target with the original payload, and deletes the message on success. The Lambda approach gives you more control over error handling during replay — for instance, routing events that fail a second time to a separate audit queue rather than back to the same DLQ.
For high-volume scenarios where you need to replay thousands of events, consider enabling EventBridge Archive on the source bus and using the native Replay feature. Archived events are stored at s3://your-bucket/AWSLogs/<account>/EventBridge/<region>/ and can be replayed through the console or CLI with time-window filtering — a cleaner option than processing a large DLQ backlog manually.
Troubleshooting
The following three failure patterns account for the majority of production issues with this setup.
Missing or misconfigured SQS resource policy. If EventBridge cannot write to the DLQ, failed events are still discarded silently — the DLQ attachment does not help if the permission is absent. Symptoms: the DLQ stays empty despite confirmed delivery failures in CloudWatch Events metrics. Fix: verify the queue policy includes "Service": "events.amazonaws.com" as the principal and that the aws:SourceArn condition matches the exact rule ARN. A common mistake is scoping the condition to the bus ARN instead of the rule ARN, which causes the condition to never match.
Retry window exhausted before downstream recovers. If you set MaximumEventAgeInSeconds=300 but your downstream service takes eight minutes to recover from a deployment, all in-flight events during that window will exhaust retries and land in the DLQ regardless of whether the service is healthy by the time the last attempt fires. This is expected behavior, but it surprises teams who assume EventBridge will keep retrying until the window closes relative to the last attempt. The age is measured from the original event time, not from the last retry. Tune the window to match your realistic recovery SLA, or implement replay as a standard operating procedure for deployments.
DLQ messages with no recognizable correlation to the original event. EventBridge wraps the original event in its own envelope when writing to the DLQ. If your replay consumer or debugging workflow expects the raw application payload at the top level, it will find it nested under the detail key of the EventBridge event JSON. Additionally, if the original event source used a transformer on the rule target, the DLQ receives the pre-transformation payload — the transformer is not applied to DLQ delivery. This can make the DLQ message look structurally different from what the target normally receives, which confuses teams debugging the failure.
Going Further
The setup described here covers a single-account, single-bus pattern. In multi-account architectures where a central event bus receives events from spoke accounts, the DLQ strategy needs to account for cross-account delivery failures separately from intra-account target failures. Cross-account DLQs require resource policies that trust both the EventBridge service principal and the source account, and the alarm strategy should aggregate across accounts using CloudWatch cross-account observability.
EventBridge Archive and Replay is worth enabling alongside the DLQ pattern rather than instead of it. The DLQ captures events that failed delivery to a specific target; Archive captures all events that matched a rule, regardless of delivery outcome. Together they give you two independent recovery paths: targeted replay for specific delivery failures, and full event-stream replay for scenarios where you need to reprocess a time window of events after a bug fix or schema migration.
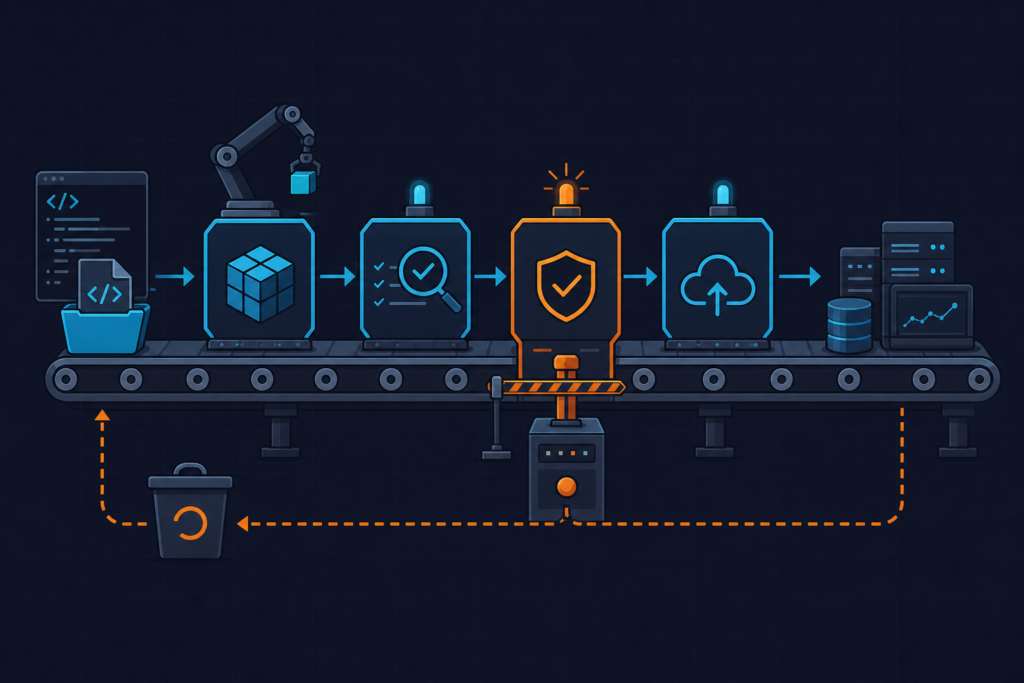
Finally, consider integrating DLQ depth into your CI/CD pipeline as a deployment gate. If a deployment causes DLQ message volume to spike above a threshold within the first five minutes, an automated rollback triggered by the CloudWatch alarm — routed through an SNS topic to a Lambda that calls your deployment API — can limit blast radius without requiring manual intervention. The pipeline gate patterns covered on this site provide a starting point for wiring CloudWatch alarms into deployment workflows.