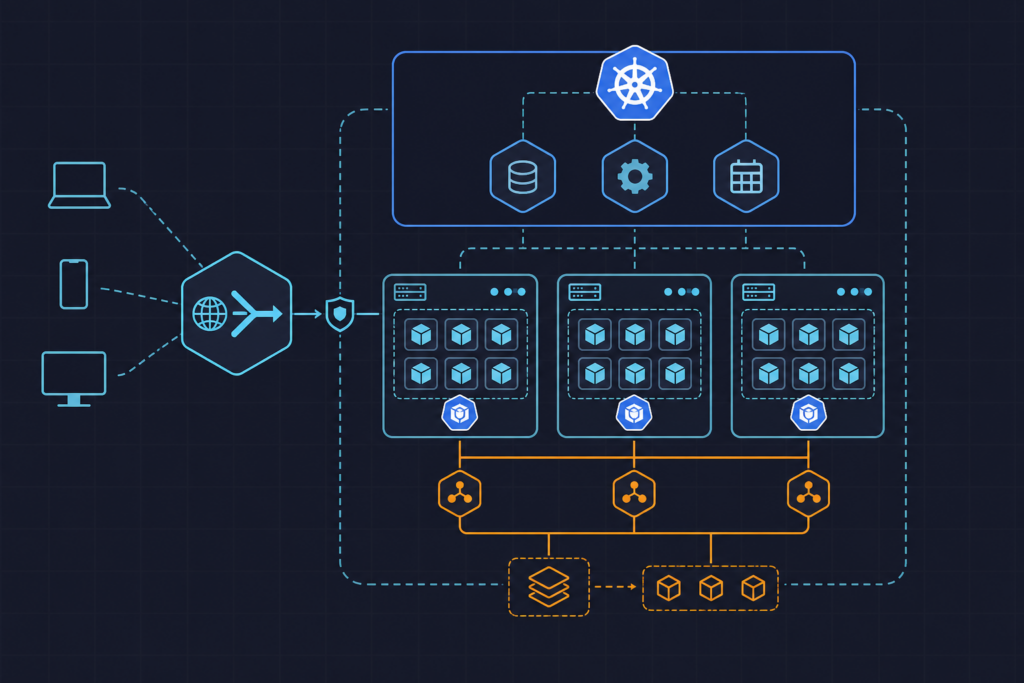
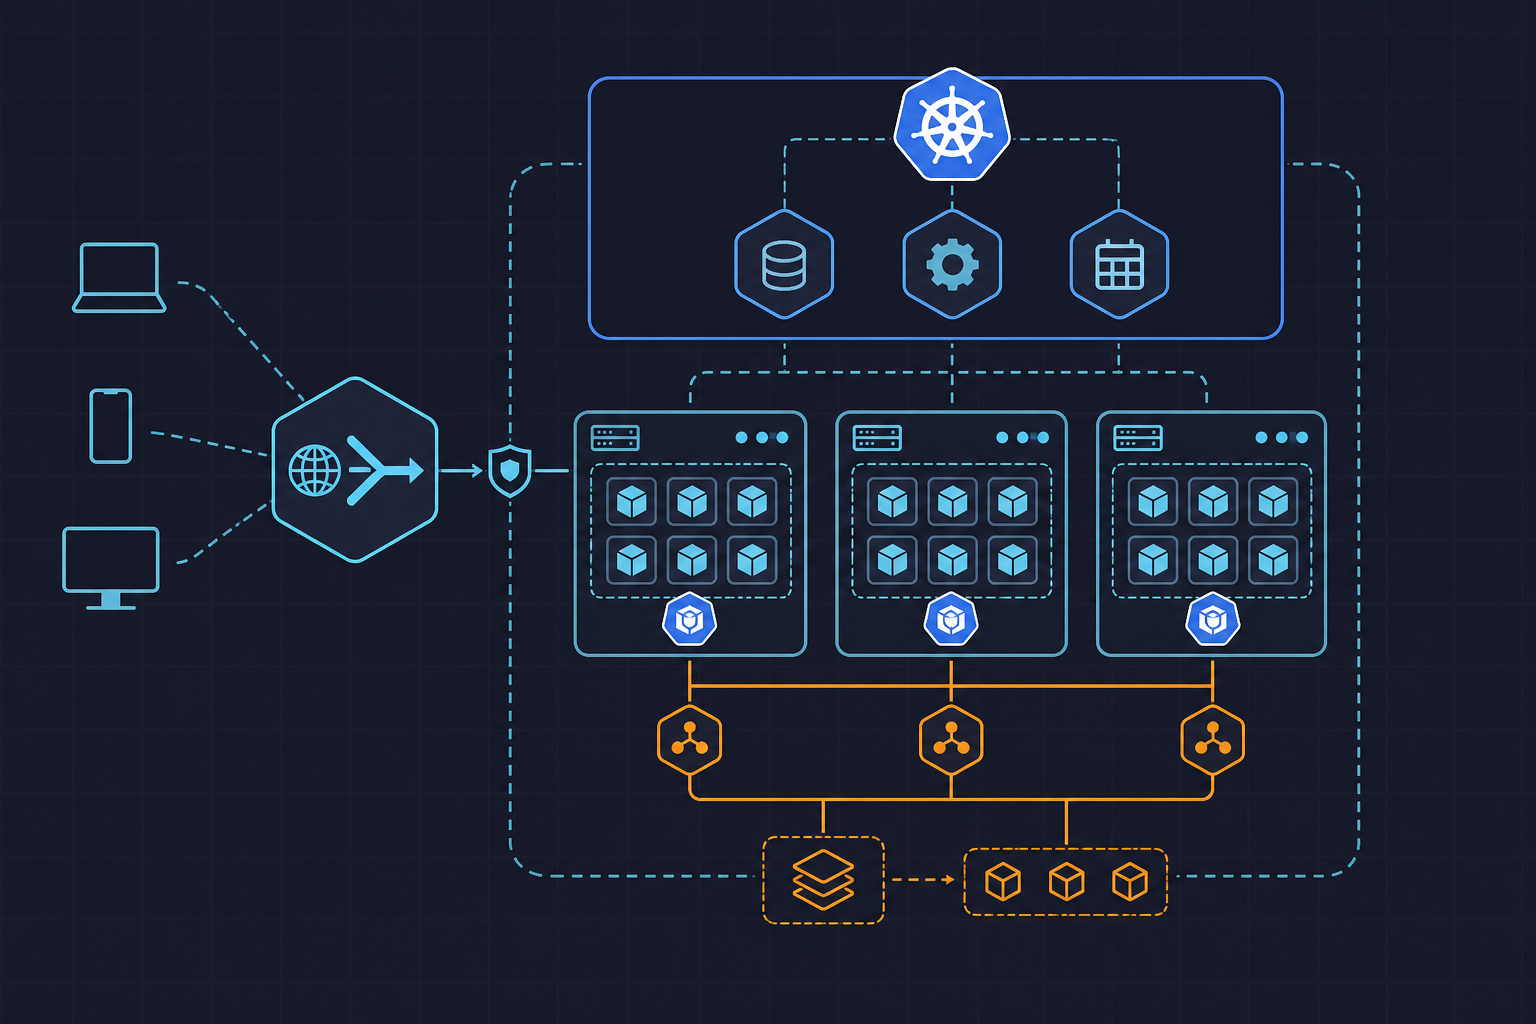
Kubernetes liveness and readiness probes are the mechanism by which the control plane decides whether a container is alive, whether it can serve traffic, and — when combined with a startup probe — whether it has finished initializing. Get them right and your workloads self-heal gracefully under load. Get them wrong and you end up with restart loops at 2 AM, or worse, a pod that silently drops requests while still appearing healthy to the scheduler.
This post covers every field that matters, annotated YAML for three distinct workload types, and a catalog of the misconfigurations that cause the most damage in real deployments.
When to use this
Before writing a single line of YAML, it helps to be precise about what each probe actually does — because conflating them is the root cause of most probe-related incidents.
Liveness probe answers one question: is this process still functional? A failure here tells Kubernetes the container has entered a state it cannot recover from on its own — a deadlock, an unhandled panic that left the process running but unresponsive, a goroutine leak that exhausted all available workers. The response is a container restart.
Readiness probe answers a different question: should this pod receive traffic right now? A failure removes the pod from the Service’s endpoint slice. The container keeps running. This is the correct tool for signaling temporary unavailability — a cache warming phase, a dependency that is momentarily unreachable, a circuit breaker that has opened. The pod recovers and re-enters rotation without a restart.
Startup probe is a gate that holds the other two probes until the application has finished initializing. It exists specifically to handle slow-starting containers without inflating initialDelaySeconds on the liveness probe to an unsafe value. Once the startup probe succeeds, it stops running and hands off to liveness and readiness.
Use all three together on any long-lived, stateful, or slow-initializing workload. For simple stateless services that start in under two seconds, a liveness and readiness pair without a startup probe is usually sufficient.
The official Kubernetes documentation on configuring liveness, readiness, and startup probes is the authoritative reference for field definitions and version-specific behavior.
Setup
To follow the examples in this post you need:
- A running Kubernetes cluster — local (kind, minikube) or remote both work.
kubectlconfigured with access to at least one namespace where you can create Deployments.- A container image that exposes HTTP health endpoints, or the willingness to use the example manifest with a placeholder image and observe probe behavior directly.
When you apply a manifest and something behaves unexpectedly, kubectl describe pod <name> is your first stop. The Events section at the bottom of the output shows probe failure messages verbatim, including the HTTP status code returned or the exit code from an exec probe. That output is far more informative than the pod status column alone.
For namespace and multi-cluster context management patterns, see the DevOps_DayS archives — several posts there cover kubectl workflow optimizations that pair well with iterative probe tuning.
Configuration (with code)
The following manifest is the primary reference for this post. It configures all three probe types on a web API container, with inline comments explaining the reasoning behind each field value. Read it top to bottom before moving to the per-field breakdown below.
# deployment-with-probes.yaml
# Demonstrates liveness, readiness, and startup probes on a web API container

apiVersion: apps/v1
kind: Deployment
metadata:
  name: api-server
  namespace: production
spec:
  replicas: 3
  selector:
    matchLabels:
      app: api-server
  template:
    metadata:
      labels:
        app: api-server
    spec:
      containers:
        - name: api-server
          image: myrepo/api-server:1.4.2
          ports:
            - containerPort: 8080

          # Startup probe: gives the app up to 60s to initialize
          # (failureThreshold * periodSeconds = 30 * 2 = 60s)
          startupProbe:
            httpGet:
              path: /healthz/startup
              port: 8080
            initialDelaySeconds: 5
            periodSeconds: 2
            failureThreshold: 30

          # Liveness probe: restarts the container if the process deadlocks
          livenessProbe:
            httpGet:
              path: /healthz/live
              port: 8080
            initialDelaySeconds: 0   # startup probe guards this window
            periodSeconds: 10
            timeoutSeconds: 3
            failureThreshold: 3
            successThreshold: 1

          # Readiness probe: removes pod from Service endpoints during degraded state
          readinessProbe:
            httpGet:
              path: /healthz/ready
              port: 8080
            initialDelaySeconds: 0
            periodSeconds: 5
            timeoutSeconds: 2
            failureThreshold: 2
            successThreshold: 2      # require two consecutive successes before re-adding

          # Example exec probe (commented out - alternative for non-HTTP containers)
          # livenessProbe:
          #   exec:
          #     command:
          #       - /bin/sh
          #       - -c
          #       - "pg_isready -U postgres"
          #   periodSeconds: 15
          #   failureThreshold: 3

          resources:
            requests:
              cpu: "100m"
              memory: "128Mi"
            limits:
              cpu: "500m"
              memory: "256Mi"
Here is what each configurable field controls and why the values above were chosen:
initialDelaySeconds
Defines how long Kubernetes waits after the container starts before firing the first probe. When a startup probe is present, set this to 0 on liveness and readiness — the startup probe already holds the gate. Without a startup probe, this value must exceed your application’s worst-case cold-start time. Underestimating it is the single most common cause of unnecessary restarts on fresh deployments.
periodSeconds
How frequently the probe runs. The default is 10 seconds. Dropping this below 5 seconds on a high-traffic pod can generate enough probe traffic to cause false positives — the health endpoint itself becomes a source of latency under load. For readiness probes on latency-sensitive services, 5 seconds is a reasonable floor.
failureThreshold
How many consecutive failures are required before the probe action triggers. The default is 3. Lowering it to 1 on a liveness probe means a single slow response — perhaps during a GC pause or a momentary spike — restarts your container. Raising it too high on a readiness probe means a degraded pod stays in rotation longer than it should. The values in the manifest above (3 for liveness, 2 for readiness) reflect a deliberate asymmetry: be conservative about restarts, be quicker to pull traffic.
successThreshold
How many consecutive successes are required to transition from failing to passing. For liveness, this must always be 1 — the spec does not allow a higher value. For readiness, setting it to 2 (as shown above) prevents a pod from re-entering rotation on a single successful response, which matters when a dependency is flapping.
timeoutSeconds
How long Kubernetes waits for a probe response before counting it as a failure. The default is 1 second. For any health endpoint that performs a real dependency check — a database ping, a cache lookup — set this to at least 2–3 seconds to avoid false positives from normal network jitter.
httpGet fields
Beyond path and port, httpGet accepts scheme (HTTP or HTTPS), and httpHeaders for cases where the health endpoint requires a specific host header or authentication token. The conventional paths /healthz, /healthz/live, and /healthz/ready follow the pattern used by Kubernetes system components themselves and are widely supported by frameworks like Spring Boot Actuator, FastAPI, and Go’s standard library.
Examples
Three workload patterns cover the majority of probe configurations you will encounter in practice.
Web API — httpGet
The manifest above is the canonical example. The key design decision is separating /healthz/live from /healthz/ready. The liveness endpoint should return 200 as long as the process is not deadlocked — it should not check downstream dependencies. The readiness endpoint should return 200 only when the service can actually handle a request end-to-end, including database connectivity and any required caches being warm.
Database sidecar — tcpSocket
A PostgreSQL or Redis sidecar does not expose an HTTP server. The tcpSocket probe attempts a TCP connection on the specified port. A successful three-way handshake counts as a pass; a refused or timed-out connection counts as a failure. This is not a deep health check — it confirms the process is listening, not that it can execute queries — but it is sufficient for liveness on most database containers.
livenessProbe:
  tcpSocket:
    port: 5432
  initialDelaySeconds: 15
  periodSeconds: 20
  failureThreshold: 3

readinessProbe:
  tcpSocket:
    port: 5432
  initialDelaySeconds: 5
  periodSeconds: 10
  failureThreshold: 2
Batch job sidecar — exec
For a container that runs a background process with no network interface, an exec probe runs a command inside the container. A zero exit code is success; anything else is failure. The pg_isready example from the manifest comments is a practical illustration — it is a lightweight binary that ships with PostgreSQL client tools and returns a meaningful exit code without opening a full connection.
livenessProbe:
  exec:
    command:
      - /bin/sh
      - -c
      - "pg_isready -U postgres -h 127.0.0.1"
  initialDelaySeconds: 10
  periodSeconds: 15
  timeoutSeconds: 5
  failureThreshold: 3
One important constraint: the command runs inside the container’s filesystem and process namespace. If the binary you want to call is not present in the image, the probe will always fail with a non-zero exit code. Verify the binary exists before deploying.
Common mistakes
These are the failure patterns that appear repeatedly in production incident reviews.
Using the same endpoint for liveness and readiness
This is the most consequential mistake. When a downstream dependency becomes unavailable, a shared endpoint causes the liveness probe to fail, which triggers a container restart. The restarted container immediately hits the same unavailable dependency, fails again, and restarts again — a restart loop that takes the entire pod out of service rather than gracefully shedding traffic. Liveness must reflect only the health of the local process. Readiness can and should check dependencies.
Setting initialDelaySeconds too low without a startup probe
An application that takes 20 seconds to complete its startup sequence, configured with an initialDelaySeconds of 5, will fail its liveness probe three times before it finishes booting and get restarted. The restart resets the timer. The pod never becomes ready. The fix is either a startup probe (preferred for slow starters) or an initialDelaySeconds value that genuinely exceeds the worst-case startup time observed in your environment.
Setting failureThreshold to 1 on liveness
A single probe timeout — from a GC pause, a momentary CPU spike, or a slow DNS response — becomes an immediate container restart. In a three-replica deployment this can cascade: all three pods restart in close succession, causing a brief but complete service outage. The default of 3 exists for a reason. Do not lower it without a specific, documented justification.
Probe timeoutSeconds shorter than the health endpoint’s response time
If your /healthz/ready endpoint queries a database to confirm connectivity and that query occasionally takes 1.5 seconds, a timeoutSeconds: 1 configuration will generate intermittent false failures. These show up in kubectl describe pod as timeout events and are frequently misread as application instability. Always set timeoutSeconds to at least 2x the 99th-percentile response time of the health endpoint itself.
Omitting probes entirely on long-running containers
Without a liveness probe, a deadlocked container runs indefinitely. Without a readiness probe, a pod that has lost its database connection continues to receive traffic and return 500s. Kubernetes has no way to distinguish a healthy pod from a broken one without probe configuration. For any workload that runs longer than a few minutes, both probes are non-optional.
exec probes that spawn expensive subprocesses
An exec probe that calls a shell script, which in turn runs several commands and pipes output through grep, runs at periodSeconds frequency inside the container. At 10-second intervals on a CPU-constrained container, this adds measurable overhead. Keep exec probe commands minimal — a single binary call with a fast exit path is the correct pattern.
Probe tuning is iterative. Start with conservative values, observe behavior under realistic load using kubectl describe pod and your metrics stack, and tighten thresholds only when you have data to support the change. The configuration in this post is a solid starting point for most workloads, but no set of defaults survives contact with a production traffic pattern unchanged.