Overview
Argo CD progressive delivery with automated canary health gates solves a problem that conventional rolling updates cannot: they give you no mechanism to pause, measure, and abort a release based on real traffic signals before the blast radius grows. A standard Kubernetes Deployment rolls forward on pod readiness alone. If your new image introduces a regression that only manifests under production load — elevated error rates, increased latency, upstream timeouts — the rollout completes before anyone notices.
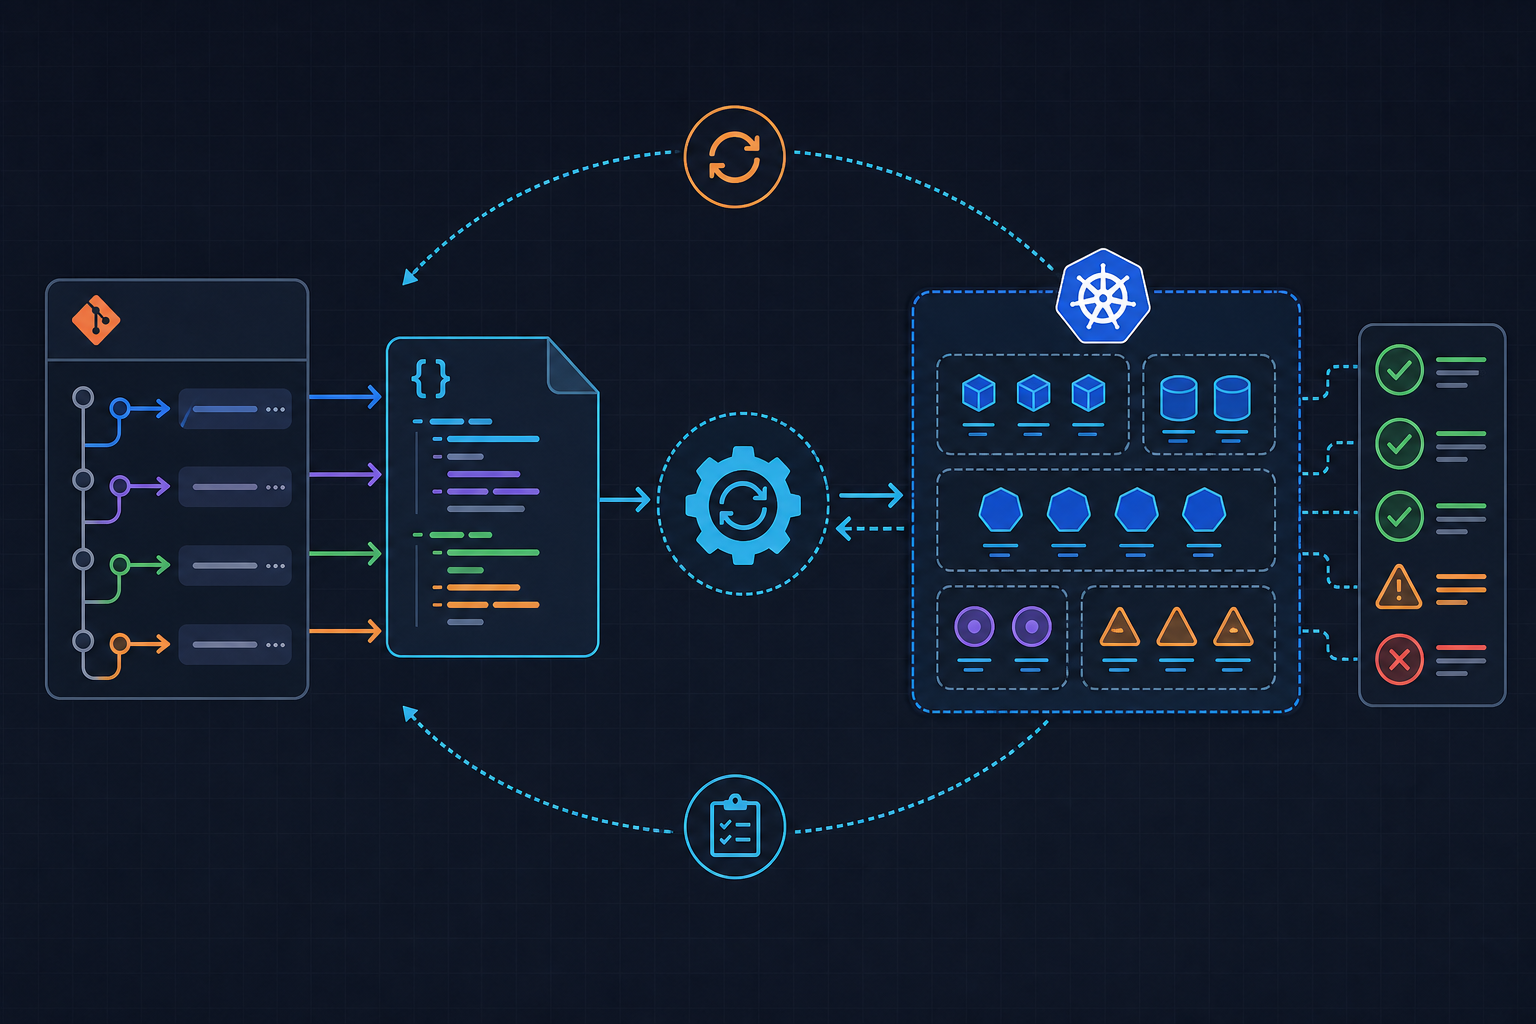
Argo Rollouts extends the Kubernetes API with a Rollout custom resource that replaces the Deployment object and adds a strategy engine on top. Combined with Argo CD’s GitOps reconciliation loop, the workflow becomes fully declarative: you commit a new image tag, Argo CD syncs the manifest, and the Rollouts controller advances through weighted canary steps only when Prometheus-backed AnalysisTemplate queries confirm the release is healthy. A single bad data point at a failureLimit: 0 gate aborts the rollout and pins traffic back to the stable revision automatically.
This tutorial covers the full operational path: migrating from a Deployment to a Rollout, authoring analysis templates that query real HTTP error-rate metrics, triggering a release through Argo CD, and watching the canary progress in real time. We also cover the edge cases that catch teams off guard — duplicate ReplicaSets from leftover selectors, stalled analysis runs, and the Argo CD health-check configuration that is easy to miss.
For related GitOps patterns on this site, see the kuryzhev.cloud DevOps archive, including the earlier post on Argo CD sync and rollback fundamentals. The authoritative reference for everything in this tutorial lives in the Argo Rollouts official documentation.
Before You Start
Before writing a single manifest, confirm the following prerequisites are in place. Skipping any one of them accounts for the majority of the troubleshooting scenarios we cover later.
- Kubernetes cluster — version 1.25 or later, with
kubectlconfigured and pointing at the correct context. All examples use theproductionnamespace. - Argo CD — installed and managing at least one Application. The Rollout resource requires a custom health check entry in
argocd-cm; we configure that in Step 1. - Argo Rollouts controller — install it into its own namespace with the upstream manifest. This is a one-time cluster-level operation:
kubectl create namespace argo-rollouts
kubectl apply -n argo-rollouts \
-f https://github.com/argoproj/argo-rollouts/releases/latest/download/install.yaml- kubectl argo rollouts plugin — the CLI plugin is separate from the controller. Install the binary matching your controller version from the Argo Rollouts releases page and place it on your
PATH. Verify withkubectl argo rollouts version. - Prometheus — reachable from within the cluster at a known service address. The analysis templates in this tutorial assume
http://prometheus.monitoring.svc.cluster.local:9090. Adjust the address to match your stack. - Two Kubernetes Services — a
web-app-stableService and aweb-app-canaryService, both selectingapp: web-app. The Rollouts controller manipulates these Services’ selectors dynamically to split traffic. Create them before applying the Rollout manifest. - Existing Deployment removed — if you are migrating a live workload, scale the old
Deploymentto zero and delete it before applying theRollout. Leaving theDeploymentin place with the samespec.selectorcauses duplicate ReplicaSets and undefined traffic behavior.
Step 1 – Define the Rollout Resource with Canary Steps
The Rollout resource at apiVersion: argoproj.io/v1alpha1 is structurally close to a Deployment — it carries the same spec.template pod spec — but its spec.strategy block is where the canary logic lives. The .spec.strategy.canary.steps[] array is evaluated in order; each entry is one of three types: setWeight (shift traffic percentage), pause (hold for a fixed duration or indefinitely), or analysis (run an AnalysisTemplate and gate on its result).
Before applying the manifest below, patch argocd-cm to teach Argo CD how to interpret Rollout health. Without this, Argo CD marks the Application as Progressing indefinitely and your sync status becomes noise:
kubectl -n argocd patch configmap argocd-cm --type merge -p '{
  "data": {
    "resource.customizations.health.argoproj.io_Rollout": "hs = {}\nhs.status = \"Progressing\"\nhs.message = \"\"\nif obj.status ~= nil then\n  if obj.status.phase == \"Healthy\" then\n    hs.status = \"Healthy\"\n  end\n  if obj.status.phase == \"Degraded\" then\n    hs.status = \"Degraded\"\n  end\nend\nreturn hs\n"
  }
}'
Now apply the full Rollout manifest. The strategy below routes 10 % of traffic to the canary for two minutes, runs an error-rate analysis, then advances to 40 % for five minutes with a second analysis gate before promoting to 100 %:
# rollout-with-analysis.yaml
apiVersion: argoproj.io/v1alpha1
kind: Rollout
metadata:
  name: web-app
  namespace: production
spec:
  replicas: 10
  revisionHistoryLimit: 3
  selector:
    matchLabels:
      app: web-app
  template:
    metadata:
      labels:
        app: web-app
    spec:
      containers:
        - name: web-app
          image: registry.kuryzhev.cloud/web-app:1.0.0
          ports:
            - containerPort: 8080
          readinessProbe:
            httpGet:
              path: /healthz
              port: 8080
            initialDelaySeconds: 5
            periodSeconds: 10
  strategy:
    canary:
      canaryService: web-app-canary
      stableService: web-app-stable
      steps:
        - setWeight: 10
        - pause: {duration: 2m}
        - analysis:
            templates:
              - templateName: error-rate-check
            args:
              - name: service
                value: web-app-canary
        - setWeight: 40
        - pause: {duration: 5m}
        - analysis:
            templates:
              - templateName: error-rate-check
            args:
              - name: service
                value: web-app-canary
        - setWeight: 100
Apply it with kubectl apply -f rollout-with-analysis.yaml. The initial apply creates the stable revision — no canary traffic is routed yet because no image change has occurred.
One operational note: without a service mesh such as Istio or Linkerd, the canary weight is approximated by pod count ratio rather than precise HTTP-level percentage. At 10 replicas and 10 % weight, the controller schedules 1 canary pod and 9 stable pods. The traffic split is therefore only as accurate as your load balancer’s round-robin behavior. If you need exact percentage-based HTTP splitting, integrate a trafficRouting block pointing at your service mesh or ingress controller — the Argo Rollouts documentation covers each integration in detail.
Step 2 – Configure Analysis Templates and Health Gates
An AnalysisTemplate defines what “healthy” means for your service in quantitative terms. The controller instantiates an AnalysisRun each time the rollout hits an analysis step, executes the configured metric queries on the defined interval, and evaluates the successCondition expression against each result. If the run exceeds failureLimit failed measurements, the rollout is aborted and the controller scales the canary back to zero.
The template below measures the HTTP 5xx error rate over a two-minute window, sampled three times at sixty-second intervals. A failureLimit of 1 means the rollout tolerates one bad sample before aborting — useful during the initial 10 % stage where sample volume is low. At higher traffic percentages you may want to tighten this to 0:
apiVersion: argoproj.io/v1alpha1
kind: AnalysisTemplate
metadata:
  name: error-rate-check
  namespace: production
spec:
  args:
    - name: service
  metrics:
    - name: http-error-rate
      interval: 60s
      count: 3
      failureLimit: 1
      successCondition: result[0] < 0.05
      provider:
        prometheus:
          address: http://prometheus.monitoring.svc.cluster.local:9090
          query: |
            sum(rate(http_requests_total{service="{{args.service}}",
            status=~"5.."}[2m]))
            /
            sum(rate(http_requests_total{service="{{args.service}}"}[2m]))
A few design decisions worth explaining here:
successCondition: result[0] < 0.05— this evaluates the first (and only) vector element returned by the Prometheus query. The threshold of0.05represents a 5 % error rate ceiling. Calibrate this against your baseline SLO before going to production.- The
argsmechanism — passingserviceas an argument keeps the template reusable across multiple rollouts or environments. The Rollout manifest injects the concrete value at theanalysisstep, so you only maintain one template per metric type rather than one per service. - Prometheus query correctness — test your PromQL expression directly in the Prometheus UI before embedding it in an
AnalysisTemplate. A query that returns no data (NaNor empty vector) causes the analysis run to error, which counts againstfailureLimit. Wrap the denominator in a guard or useor vector(0)if your service may have zero traffic during off-hours.
Apply the template alongside the Rollout manifest, or commit both to your GitOps repository so Argo CD manages them together. Keeping them in the same Application means a single sync delivers both the workload definition and its health contract.
Step 3 – Trigger a Release and Observe Promotion
With the Rollout and AnalysisTemplate in place, triggering a canary cycle is as simple as updating the image tag in your Git repository and letting Argo CD sync. In a GitOps workflow you would update the tag in your Helm values file or Kustomize overlay and push the commit. For this walkthrough, we patch the image directly to demonstrate the mechanics:
kubectl argo rollouts set image web-app \
  web-app=registry.kuryzhev.cloud/web-app:1.1.0 \
  -n production
Immediately open a second terminal and stream the rollout status. This command refreshes every few seconds and shows the current step, pod counts, and any active AnalysisRun:
kubectl argo rollouts get rollout web-app --watch -n productionYou will see the controller create one canary pod (10 % of 10 replicas), then pause for two minutes. After the pause, the error-rate-check AnalysisRun starts. If all three measurements pass the successCondition, the rollout advances to setWeight: 40, scales to four canary pods, pauses for five minutes, and runs the second analysis gate. A clean run then sets weight to 100 and the stable revision is replaced.
If you need to manually advance a paused step — for example, during a staged rollout where a human approval gate precedes the analysis — use:
kubectl argo rollouts promote web-app -n productionTo inspect the AnalysisRun that was created for a specific step, list runs in the namespace and describe the relevant one:
kubectl get analysisrun -n production
kubectl describe analysisrun <run-name> -n production
The describe output includes the raw Prometheus query results for each measurement interval, which is invaluable when debugging a gate that passed or failed unexpectedly. If you want to abort an in-progress rollout and immediately return all traffic to the stable revision:
kubectl argo rollouts abort web-app -n productionAfter an abort, the rollout status moves to Degraded. To restore a healthy state without promoting the bad revision, roll back to the previous stable image:
kubectl argo rollouts undo web-app -n productionTroubleshooting
Rollout stalls at a pause step and never advances. A pause: {} step with no duration is an indefinite pause — it waits for a manual promote command. Check the rollout spec for missing duration values. Also verify the Argo Rollouts controller pod is running and its logs show no errors: kubectl logs -n argo-rollouts deploy/argo-rollouts.
AnalysisRun immediately errors with “no data returned”. The Prometheus query returned an empty vector. This typically happens when the canary Service has received no traffic yet (too early in the pause window) or when the metric labels in the query do not match the actual label set on your time series. Validate the query in the Prometheus expression browser with the exact label values before the next rollout attempt. Consider adding or vector(0) to the query to handle zero-traffic windows explicitly.
AnalysisRun fails despite the service appearing healthy. Check whether failureLimit is set to 0. A single measurement that returns NaN — caused by a scrape gap, a Prometheus restart, or a pod not yet appearing in the service endpoints — counts as a failure. Raising failureLimit to 1 during the low-traffic 10 % stage provides a reasonable safety margin without meaningfully weakening the gate.
Argo CD shows the Application as perpetually “Progressing”. The custom health check entry in argocd-cm is either missing or contains a Lua syntax error. Re-apply the patch from Step 1 and restart the Argo CD application controller pod: kubectl rollout restart deploy/argocd-application-controller -n argocd. Verify the health check is active by checking kubectl get cm argocd-cm -n argocd -o yaml.
Duplicate ReplicaSets and unexpected traffic split. This is almost always caused by a pre-existing Deployment with the same spec.selector still running in the namespace. The two controllers fight over the same pods. Delete the old Deployment completely — kubectl delete deployment web-app -n production — and confirm no orphaned ReplicaSets remain before re-applying the Rollout.
Argo CD out-of-sync on every reconcile due to Rollout status fields. Argo CD compares live resource state against the Git manifest. The Rollout controller writes status subresource fields that differ from the stored manifest, which can trigger spurious out-of-sync warnings. Ensure your Argo CD Application’s ignoreDifferences block excludes status fields on the Rollout resource, or use server-side apply to let Kubernetes manage field ownership correctly.
Going Further
The canary pattern covered here is one of two primary strategies Argo Rollouts supports. The blue-green strategy is a natural next step if your team requires instant cutover with zero overlap between old and new versions — it maintains two full replica sets and switches the active Service selector atomically. The configuration is a single strategy field change in the Rollout spec.
For teams running a service mesh, the trafficRouting block in the Rollout spec unlocks precise HTTP-level weight control. With Istio, the controller manages VirtualService weights directly, eliminating the pod-count approximation limitation described in Step 1. The Argo Rollouts documentation covers traffic management integrations for Istio, Linkerd, AWS ALB, NGINX, and Traefik.
At scale, multi-cluster progressive delivery becomes relevant: promoting a release through dev → staging → production clusters in sequence, with each cluster’s analysis results gating promotion to the next. Argo CD’s ApplicationSet controller combined with Rollouts enables this pattern without bespoke pipeline scripts. The kuryzhev.cloud blog covers related multi-environment patterns in the Helm and GitOps series.
Finally, consider enriching your AnalysisTemplate library beyond error rate. Latency percentile gates (histogram_quantile), apdex scores, and business-metric queries (order completion rate, checkout success rate) all work as Prometheus-backed analysis metrics. The more precisely your gates reflect real user impact, the more confidently you can automate promotion decisions without human sign-off on every release.